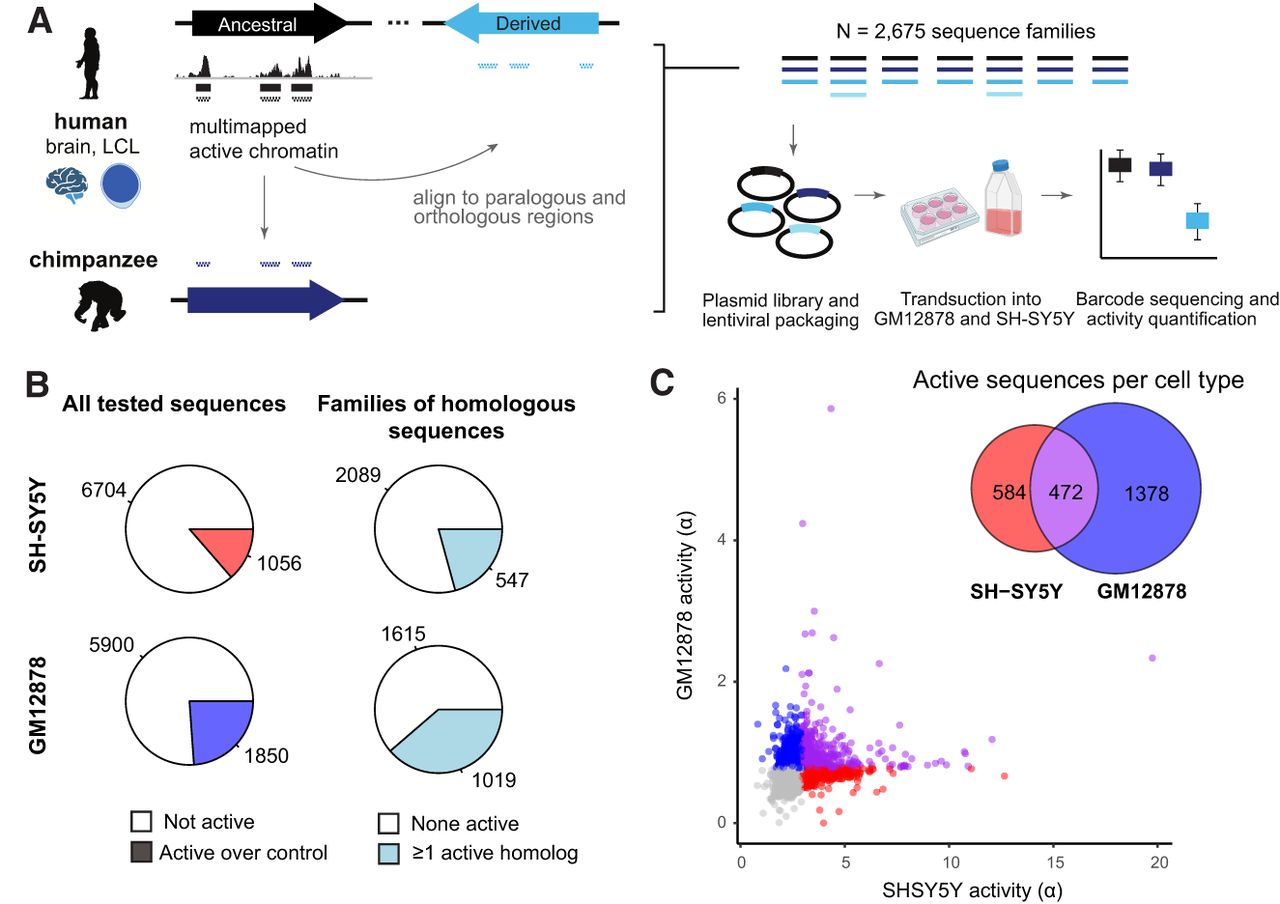
MPRA quantifies paralog-specific regulatory activity of duplicated CREs. (A) MPRA tiles were designed to multimapped chromatin accessibility and histone H3K27ac ChIP-seq data previously published from human primary brain (fetal and adult) and lymphoblastoid cell lines. Peak regions were tiled with 200-mers at 2× density in ancestral loci, and homologous positions were identified by alignment to the human and chimpanzee genomes. All unique sequences were synthesized in an oligonucleotide pool and cloned into a lentiviral vector. MPRA was performed in the neuroblastoma cell line SH-SY5Y and lymphoblastoid cell line GM12878. (B) Pie charts depict the number and proportion of active sequences (left) and sequence families containing at least one active sequence (right) for each cell type. (C) Sequence activity (estimated transcription rate, ɑ) is plotted type for 7750 tiles measured in both assays. Sequences active over negative controls are colored red (SH-SY5Y), blue (GM12878), and purple (both). The Venn diagram indicates the number of sequences in each category.