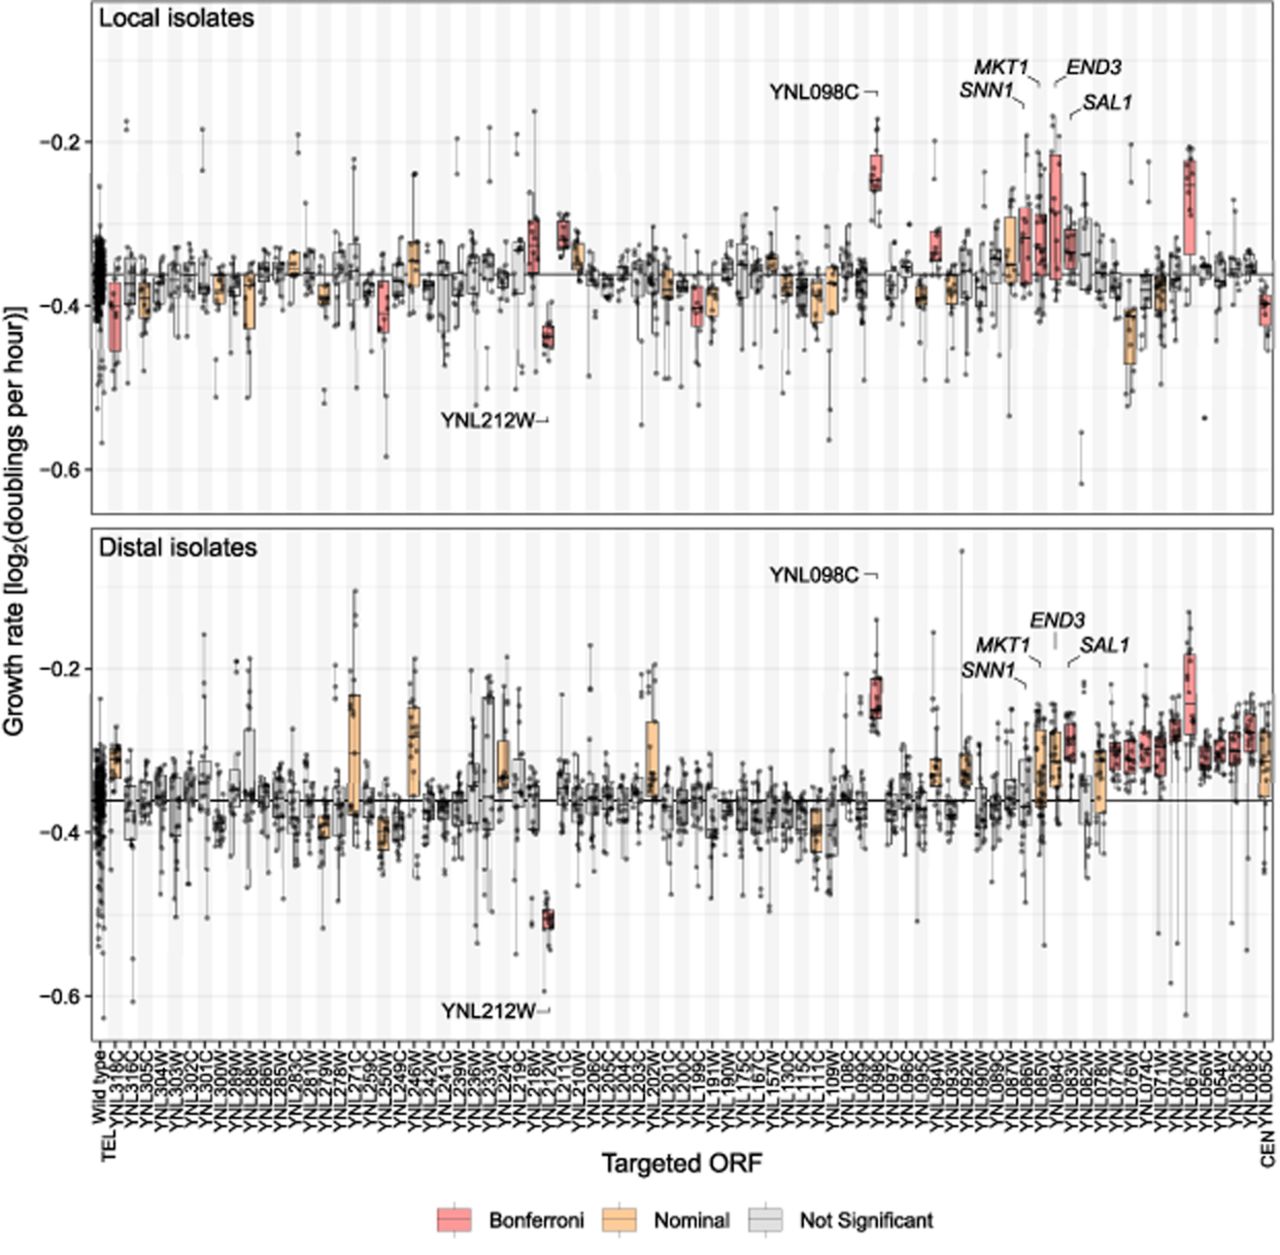
Growth rate in liquid YPD of local (top) and distal (bottom) isolates grouped by targeted ORF. Targeted ORFs are ordered by chromosomal position from telomere (TEL) to centromere (CEN). ORFs discussed in the text are labeled. Vertical lines connect replicate measurements (points) for each isolate. Box plots are based on mean measurements for each isolate; the central line marks the median, and the box extends from the first to third quartile. Growth rate is compared to the wild-type isolates on the far left. The median of the wild-type isolates is marked with a horizontal line through the plot. Red boxes indicate significance at the Bonferroni threshold of P < 0.00064; orange, P < 0.05. Phenotypes of 532 local and 525 distal isolates are shown.