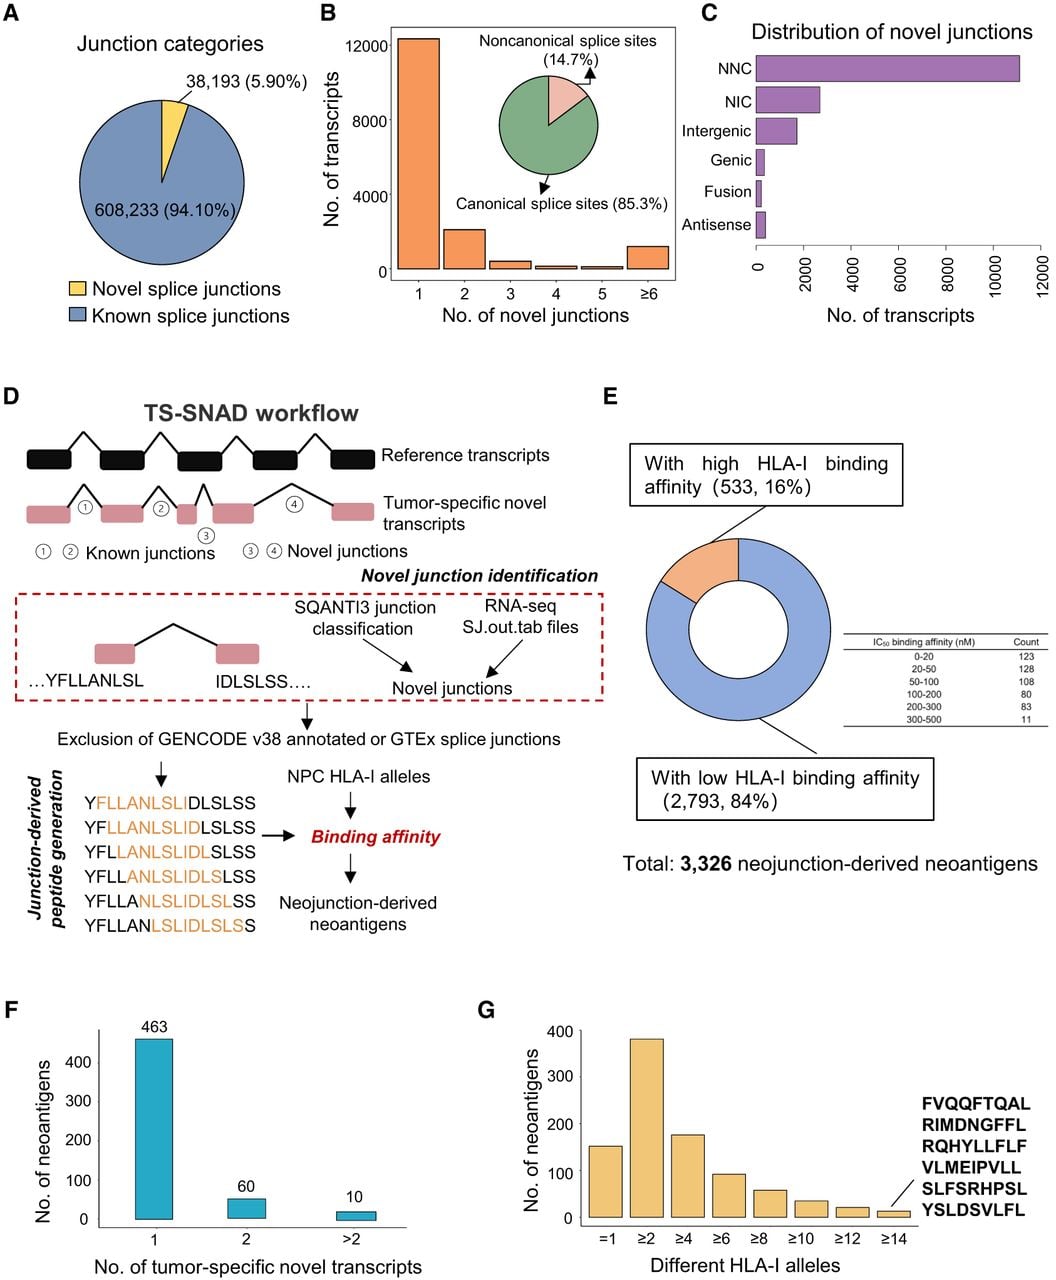
Identification of potential neojunction-derived neoantigens from tumor-specific novel transcripts using TS-SNAD. (A) Pie chart showing the distribution of splice junction categories detected by LR-seq, with known splice junctions (blue) and novel splice junctions (yellow). (B) Bar plot showing the number of transcripts with different numbers of novel splice junctions. Inset pie chart depicting the proportion of canonical and noncanonical splice sites. (C) Bar plot showing the distribution of transcripts containing novel splice junctions, categorized as NNC, NIC, intergenic, genic, fusion, or antisense. (D) Schematic overview of the TS-SNAD computational workflow for identifying neojunction-derived neoantigens from tumor-specific novel transcripts. (E) Ring plot showing that a total of 3326 neojunction-derived neoantigens were identified, of which 533 were predicted to bind strongly to at least one NPC HLA class I allele. (F) Bar plot showing the distribution of 533 strong-binding neoantigens by the number of tumor-specific novel transcripts from which they were derived. (G) Bar plot showing the number of distinct HLA class I alleles bound by the 533 neoantigens.