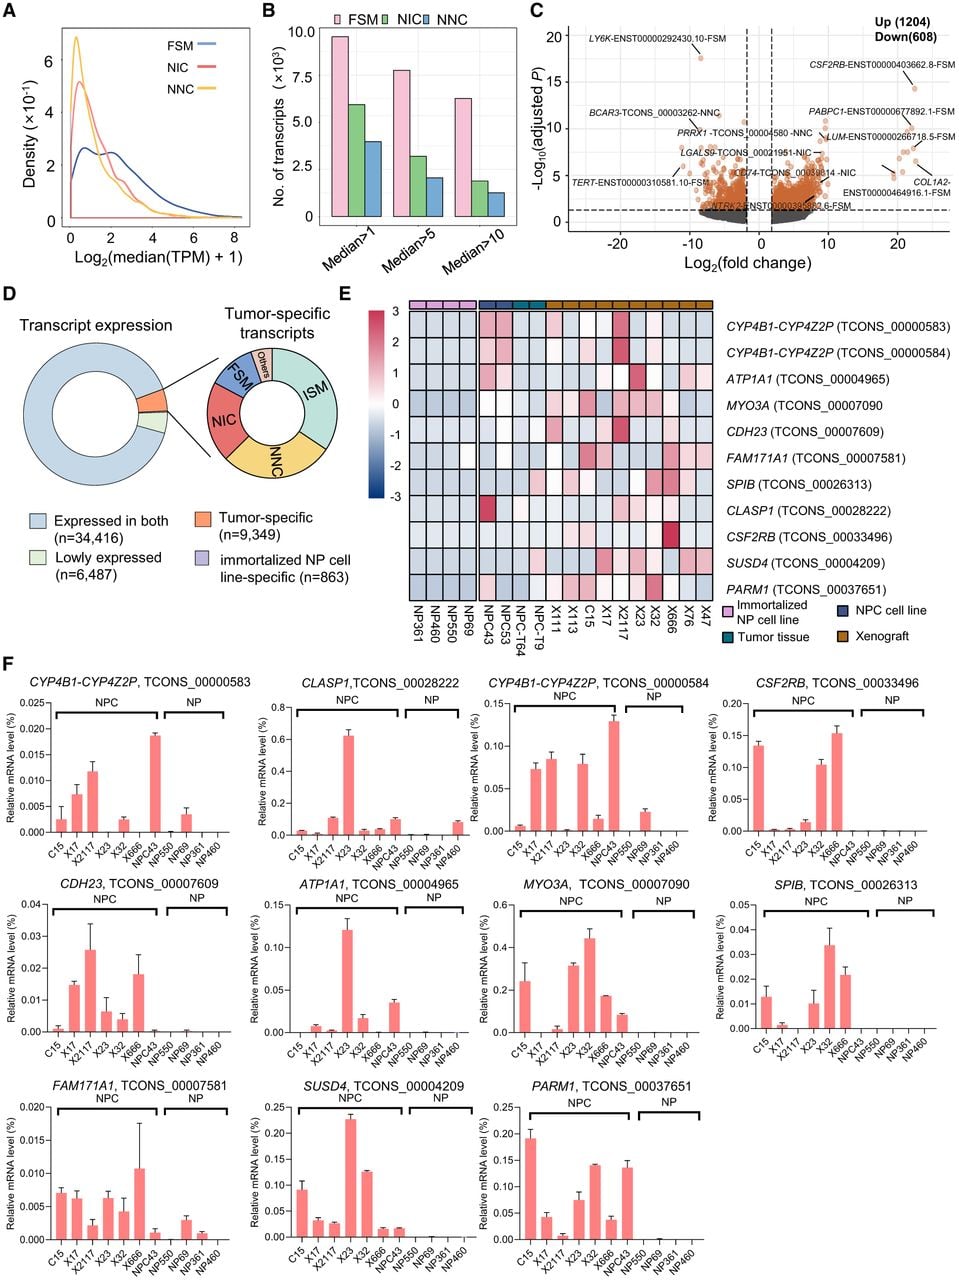
Identification and validation of tumor-specific transcripts. (A) Density curves comparing the distribution of transcript expression levels across different transcript subcategories. (B) Bar plot showing the numbers of FSM, NIC, and NNC transcripts across differential median expression thresholds. (C) Volcano plot illustrating differential transcript expression analysis between NPC tumor samples and immortalized NP cell lines (BH-adjusted P < 0.05 and |log2FC| > 2). (D) Ring charts showing the classification of transcripts according to their expression specificity. (E) Heatmap showing the expression of a subset of predicted tumor-specific novel transcripts identified in LR-seq. (F) Bar plots depicting RT-qPCR validation results of transcripts in E. RT-qPCR assays were carried out in three independent RT replicates, with error bars representing the standard deviation.