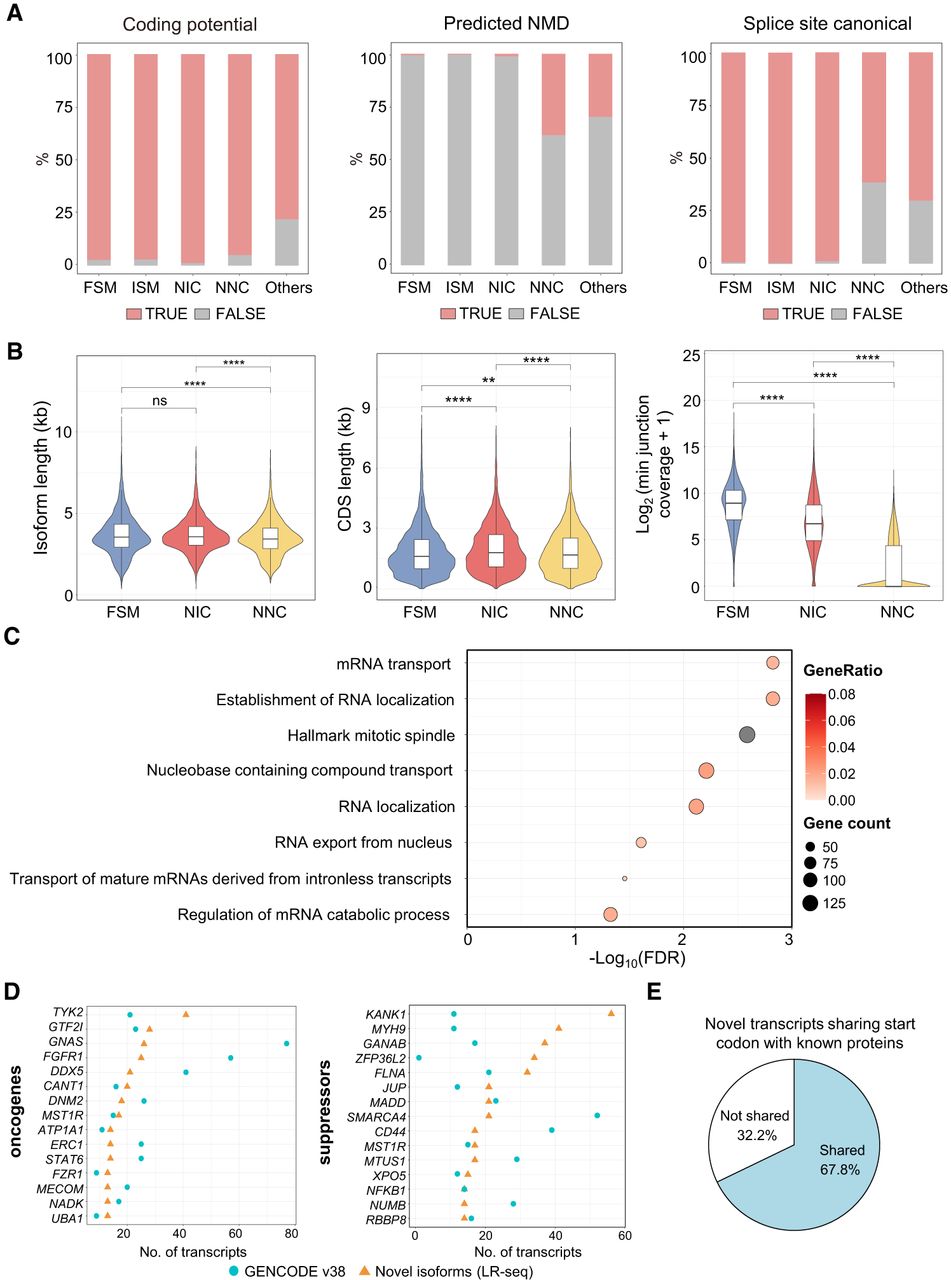
Characterization of full-length transcripts identified in LR-seq. (A) Bar plot comparing the coding potential, predicted NMD status, and splice site canonicality between transcript subcategories. (B) Box plots comparing isoform length, CDS length, and junction coverage across the FSM, NIC, and NNC transcript categories. (C) Dot plot showing pathways significantly enriched among genes with novel transcripts detected by LR-seq (FDR < 0.05), based on the MSigDB C2, C5, and Hallmark collections. Enrichment remained significant after controlling for gene expression using expression-matched permutation analysis. (D) Dot plot illustrating the numbers of novel LR-seq transcripts compared with annotated GENCODE isoforms detected in selected oncogenes (left) and tumor suppressors (right). (E) Pie chart showing the proportion of novel transcripts sharing the same translation start site as annotated protein isoforms. (NS) not significant, (*) P < 0.05, (**) P < 0.01, (***) P < 0.001, (****) P < 0.0001.