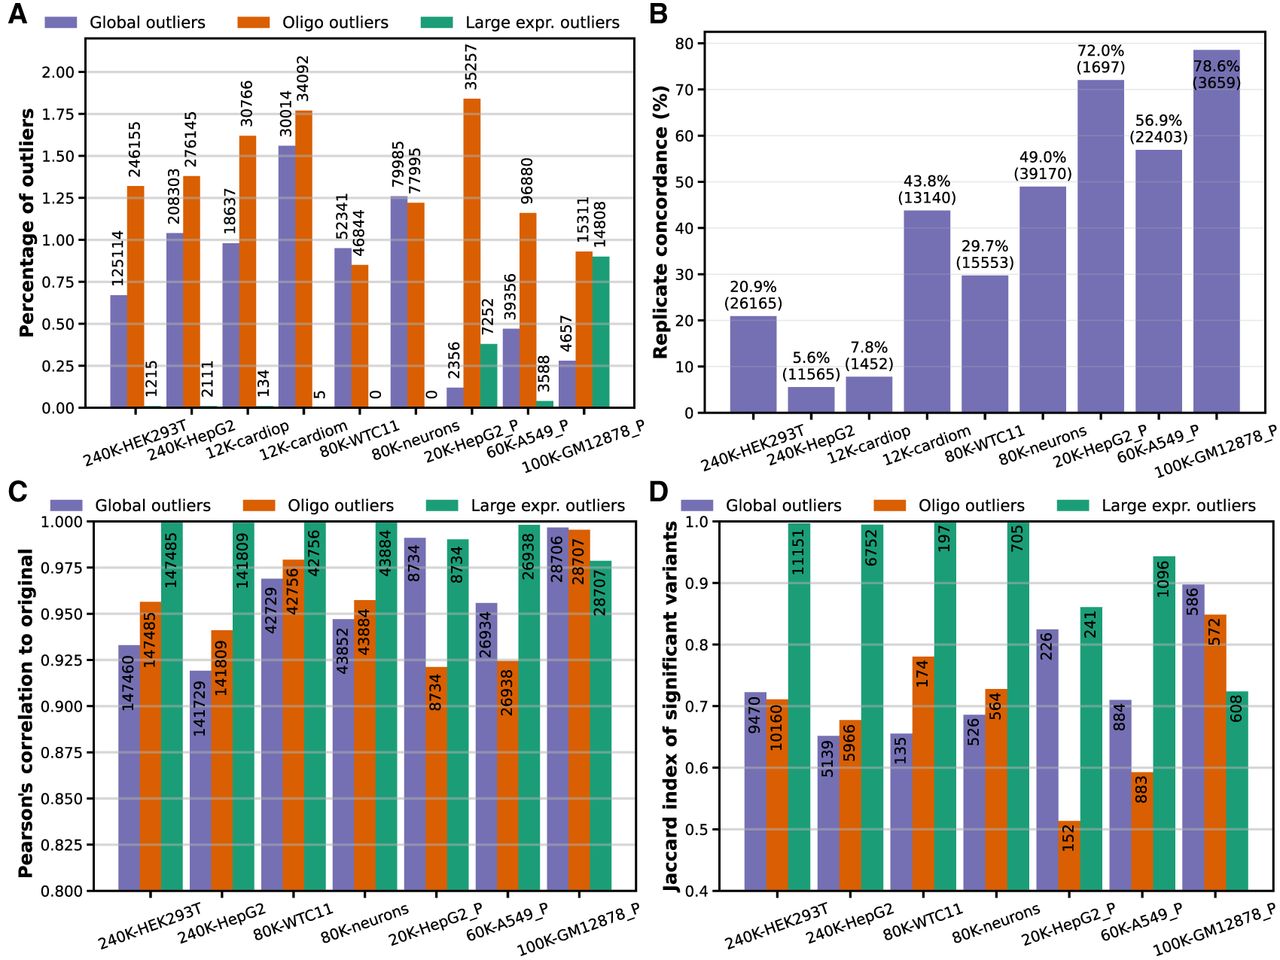
Comparison of different MPRA experiments (lenti and episomal) using different outlier detection strategies. Episomal MPRAs have an “_P” at the end of their ID. (A) Outlier detection rates on different data sets using three different methods: global outliers (blue), oligo outliers (orange), and expression outliers (green). The percentage shown is the average among the replicates for global and oligo outliers. (B) Concordance of the global outlier detection method across replicates. All lenti-based as well as the 100K episomal assays have three replicates, and the 20K and 60K episomal libraries have six and five replicates, respectively. (C) Pearson's correlation of variant coefficients between log-fold change estimates from original data sets versus data sets with outliers removed using three methods: global outliers, oligo-specific outliers (oligo outliers), and large expression outliers. Number of variants per comparison are within the bars. Only data sets with more than 1000 tested variants are shown. (D) Jaccard indices measuring overlap of significant variants detected in original versus outlier-filtered data sets. Number of overlapping significant variants are written within the bars. Only data sets with more than 1000 tested variants are shown.