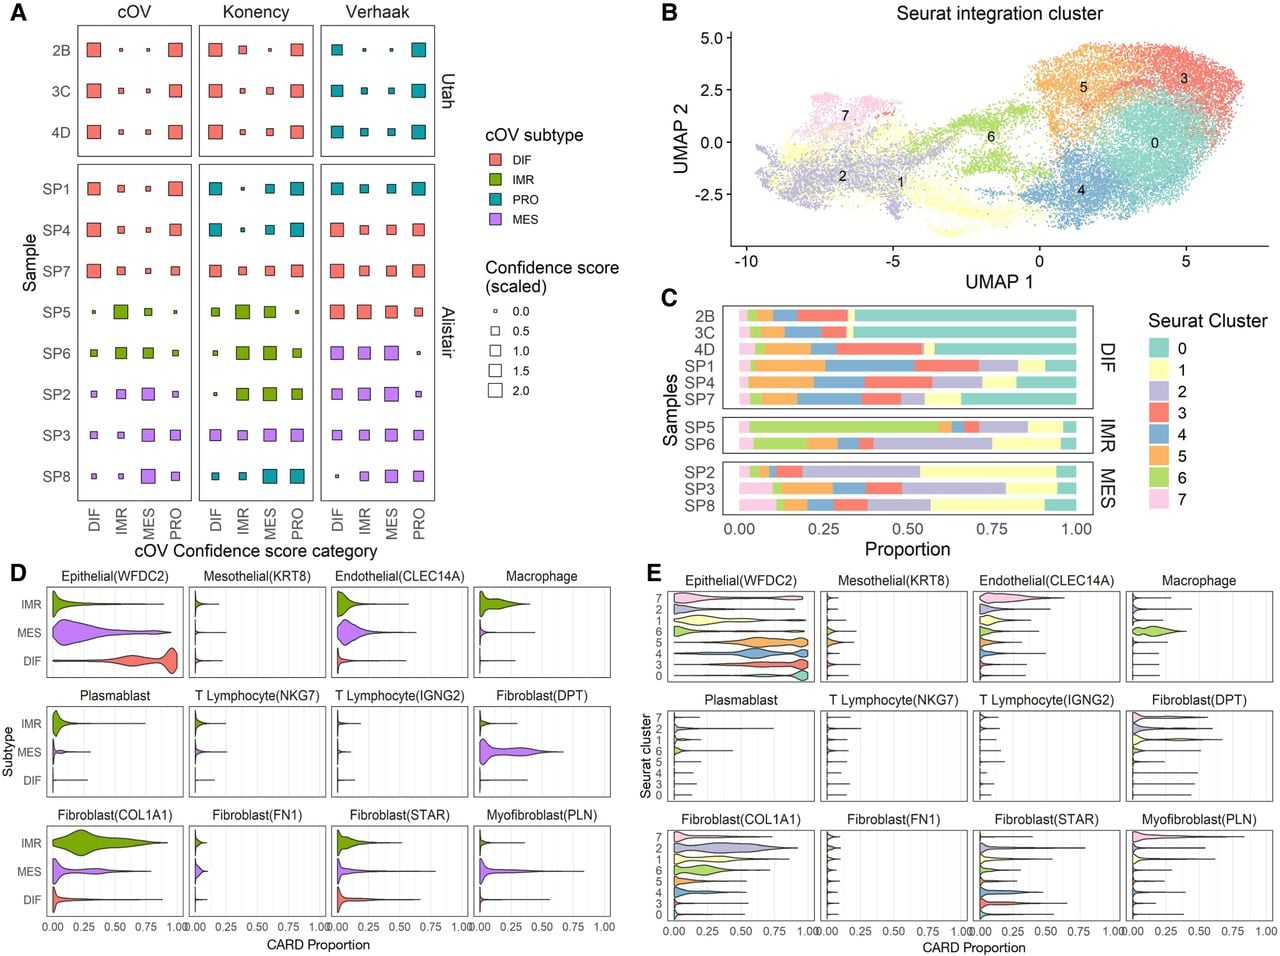
Characterizing intertumor heterogeneity using spatial transcriptomics. (A) Comparison of subtype assignment from four subtype prediction algorithms implemented by the consensusOV (cOV) R/Bioconductor package using pseudobulk RNA-seq profiles of N = 3 Utah HCI Visium samples and N = 8 Visium samples from Denisenko et al. (2024). (B) UMAP visualization of an integrated HGSC data set (from N = 11 HGSC capture areas). Colors represent the Seurat cluster of the integrated data set. (C) Bar plot showing the spot-level predicted spatial domains for all N = 11 Visium samples, with samples grouped by their predicted cOV HGSC subtype. (D) Violin plot showing the distribution of estimated cell types after applying spot-level deconvolution using CARD (Ma and Zhou 2022) for select cell types in the integrated data set, aggregated over differentiated (DIF), mesenchymal (MES), and immunoreactive (IMR) pseudobulk cOV HGSC subtypes. (E) Violin plot showing distribution of estimated cell-type proportions using CARD across the eight predicted spatial domains.