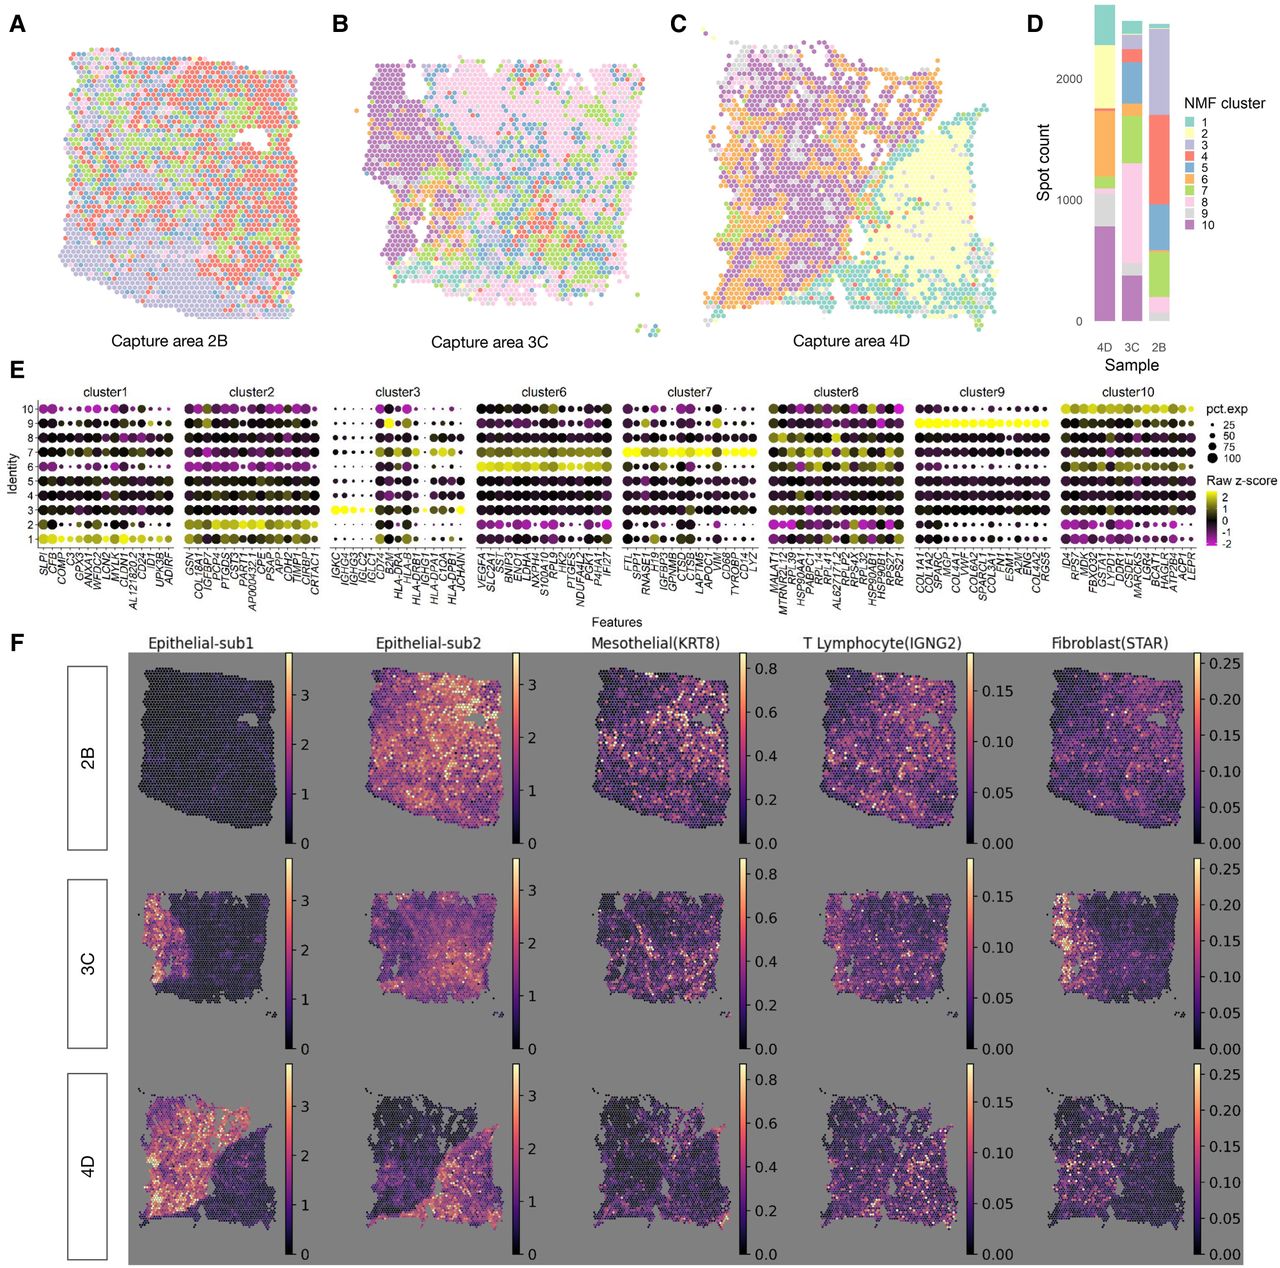
Characterizing intratumor heterogeneity using spatial transcriptomics. (A–C) Spot plot of predicted spatial domains (colors) using the R/Bioconductor package ccfindR (Woo et al. 2019) for N = 3 tissue sections (capture areas 2B, 3C, 4D) from a single HGSC tumor. (D) Stacked bar plot summarizing the proportions of predicted spatial domains across the three tissue sections. (E) Dot plot displaying expression (each scaled by standard deviation and centered at zero) of differentially expressed genes (DEGs) for the predicted spatial domains using Seurat (Hao et al. 2024) with default parameters. NMF clusters 4 and 5 had fewer than five significant DEGs and hence were omitted. (F) Visualization of cell2location (Kleshchevnikov et al. 2022) prediction of the fifth percentile of selected cell-type abundance for three capture areas (rows).