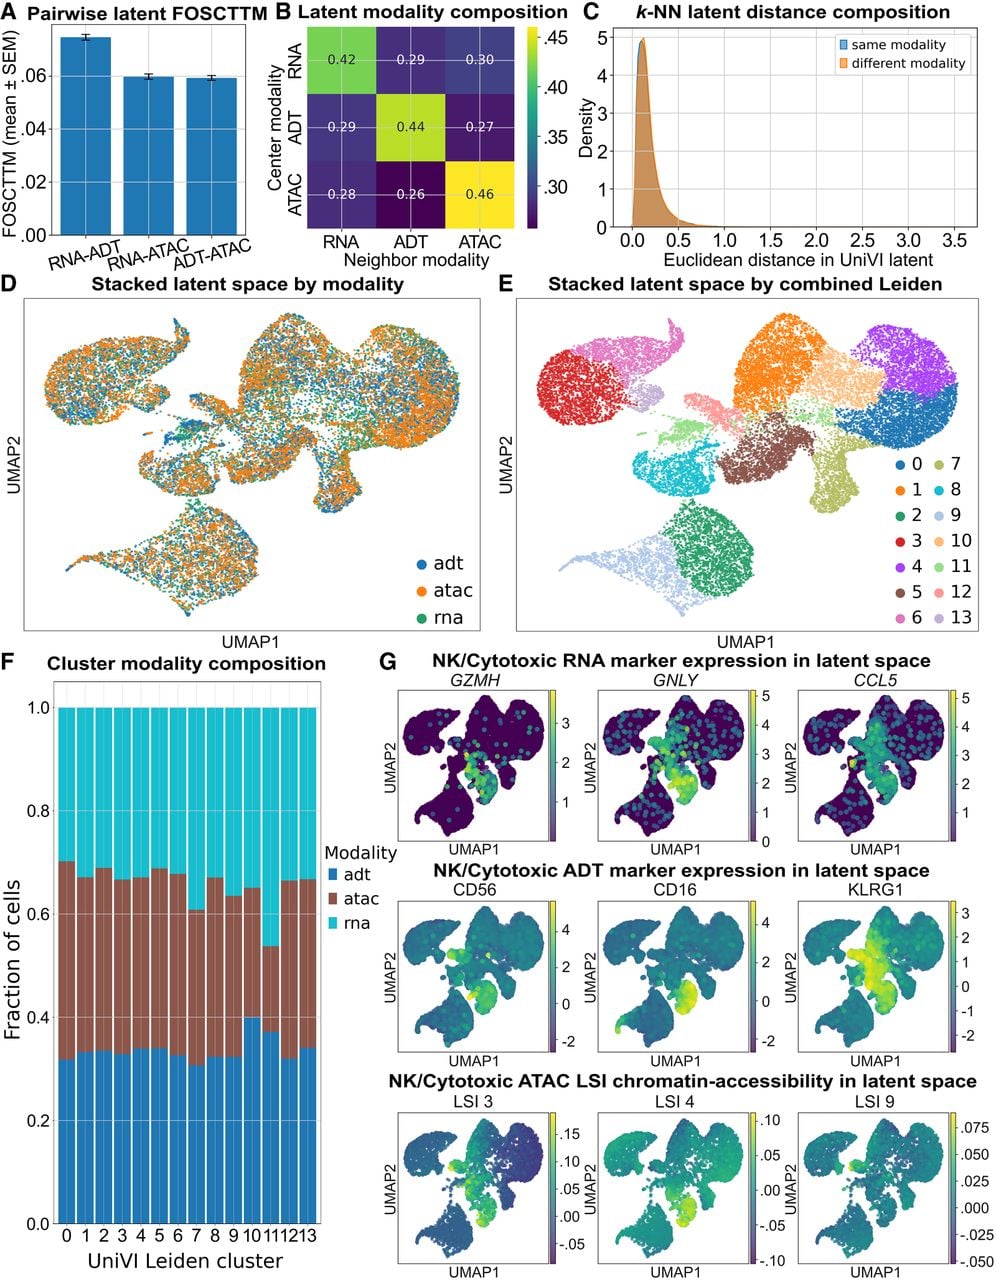
UniVI integrates trimodal TEA-seq PBMCs and is stable under a held-out partition. Model trained on wells 3–4 and 6; evaluated on held-out well 5 (all panels). (A) Pairwise FOSCTTM (mean ± SEM) on the held-out well 5 sample for RNA–ADT, RNA–ATAC, and ADT–ATAC. (B) k-NN neighbor modality composition (k = 30) in the stacked latent space for well 5 cells. (C) Distances to same- versus different-modality neighbors (k = 30) in the stacked latent space. (D) Stacked latent UMAP colored by modality (RNA, ADT, ATAC). (E) Same UMAP colored by Leiden clusters on the stacked k-NN graph (14 clusters). (F) Modality composition per Leiden cluster. (G) Marker overlays illustrating cross-modality concordance in a cytotoxic lymphocyte region: RNA (GZMH, GNLY, CCL5), ADT (CD56, CD16, KLRG1), and representative ATAC LSI dimensions (LSI 3, LSI 4, LSI 9).