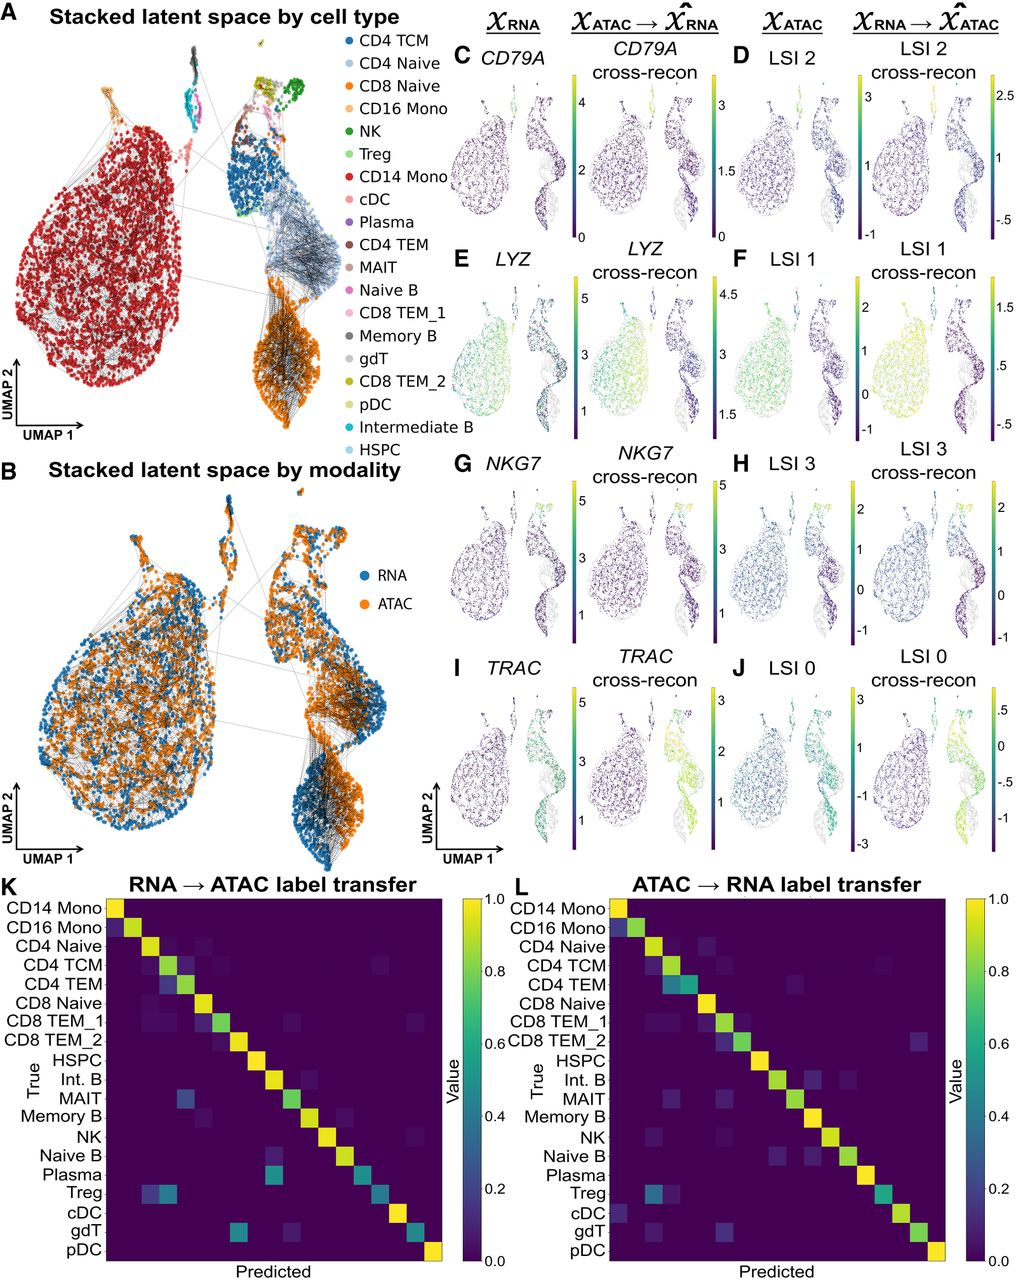
UniVI integrates paired RNA and ATAC profiles in 10x Genomics Multiome PBMCs. (A) Stacked latent UMAP of the held-out test set (n = 3137) from modality-specific posterior means (ZRNA, ZATAC); dashed segments connect paired embeddings; colored by cell type. (B) Same UMAP colored by modality (RNA vs. ATAC). (C–J) Observed (left) versus cross-modal reconstructions (right): ATAC → RNA overlays for lineage markers (CD79A, LYZ, NKG7, TRAC) and RNA → ATAC reconstructions shown in the ATAC LSI space (example components labeled per panel). (K,L) Row-normalized confusion matrices for k-NN label transfer (k = 3) RNA → ATAC and ATAC → RNA. Summary: FOSCTTM 0.0479 ± 0.00107 (SEM); RNA → ATAC ACC 0.960 (macro-F1 0.858); ATAC → RNA ACC 0.961 (macro-F1 0.892).