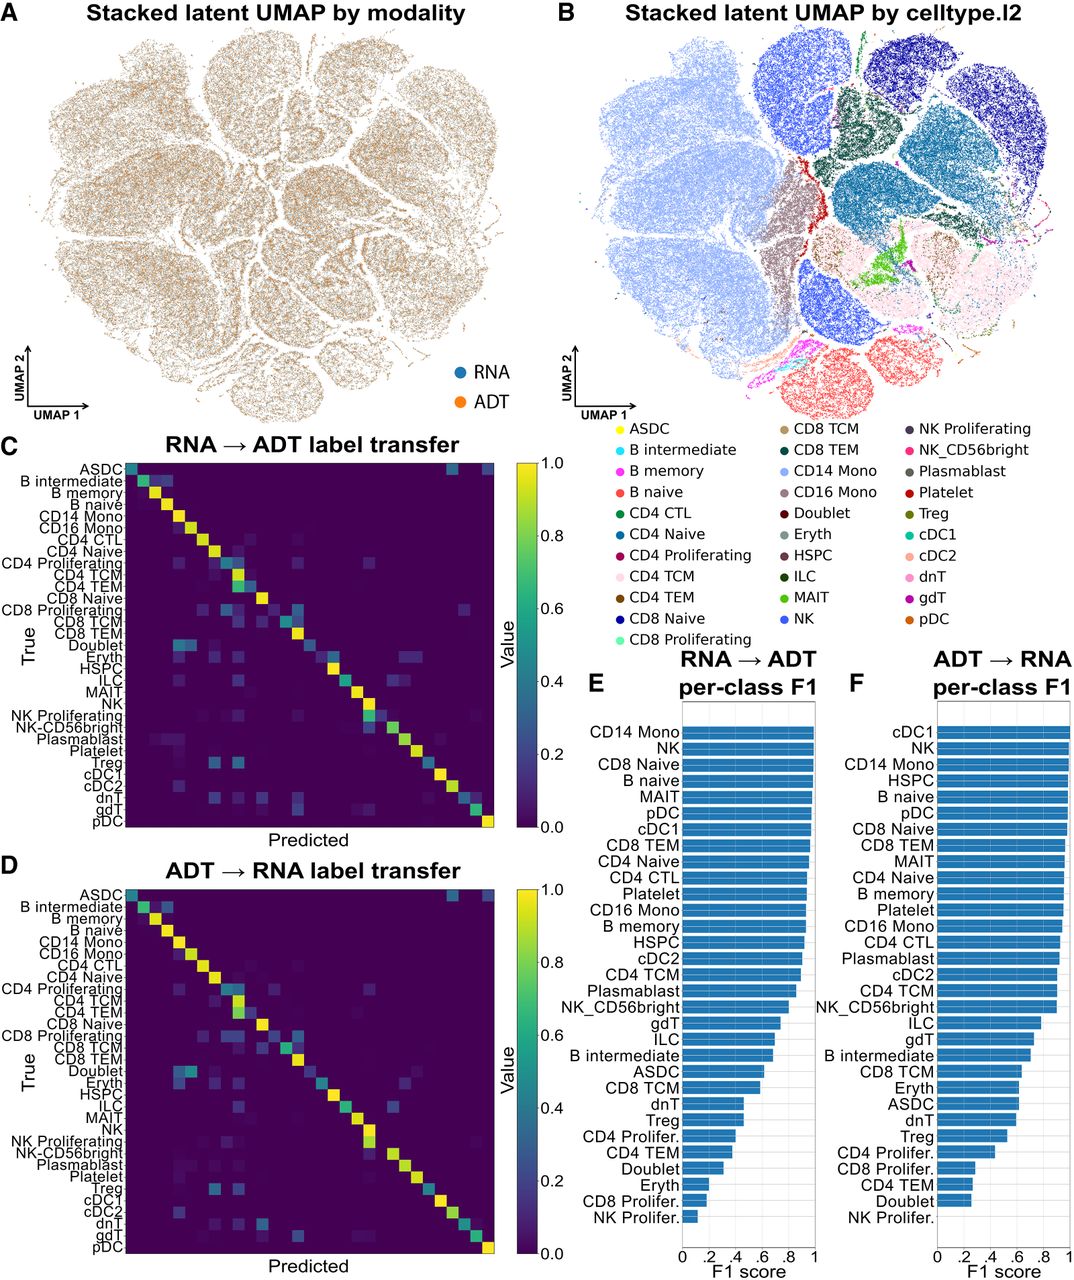
Figure 2.
UniVI integrates paired CITE-seq RNA and protein profiles. (A) Stacked latent UMAP of held-out test embeddings colored by modality (RNA vs. ADT). (B) Same UMAP colored by celltype.l2. (C,D) Row-normalized confusion matrices for RNA → ADT (C) and ADT → RNA (D) k-NN label transfer (k = 15). (E,F) Per-class F1 scores for RNA → ADT (E) and ADT → RNA (F). Summary (test set): RNA → ADT ACC 0.958 (macro-F1 0.733); ADT → RNA ACC 0.962 (macro-F1 0.763). FOSCTTM on a 20,000-cell subsample: 0.0209 ± 0.00022 (SEM).