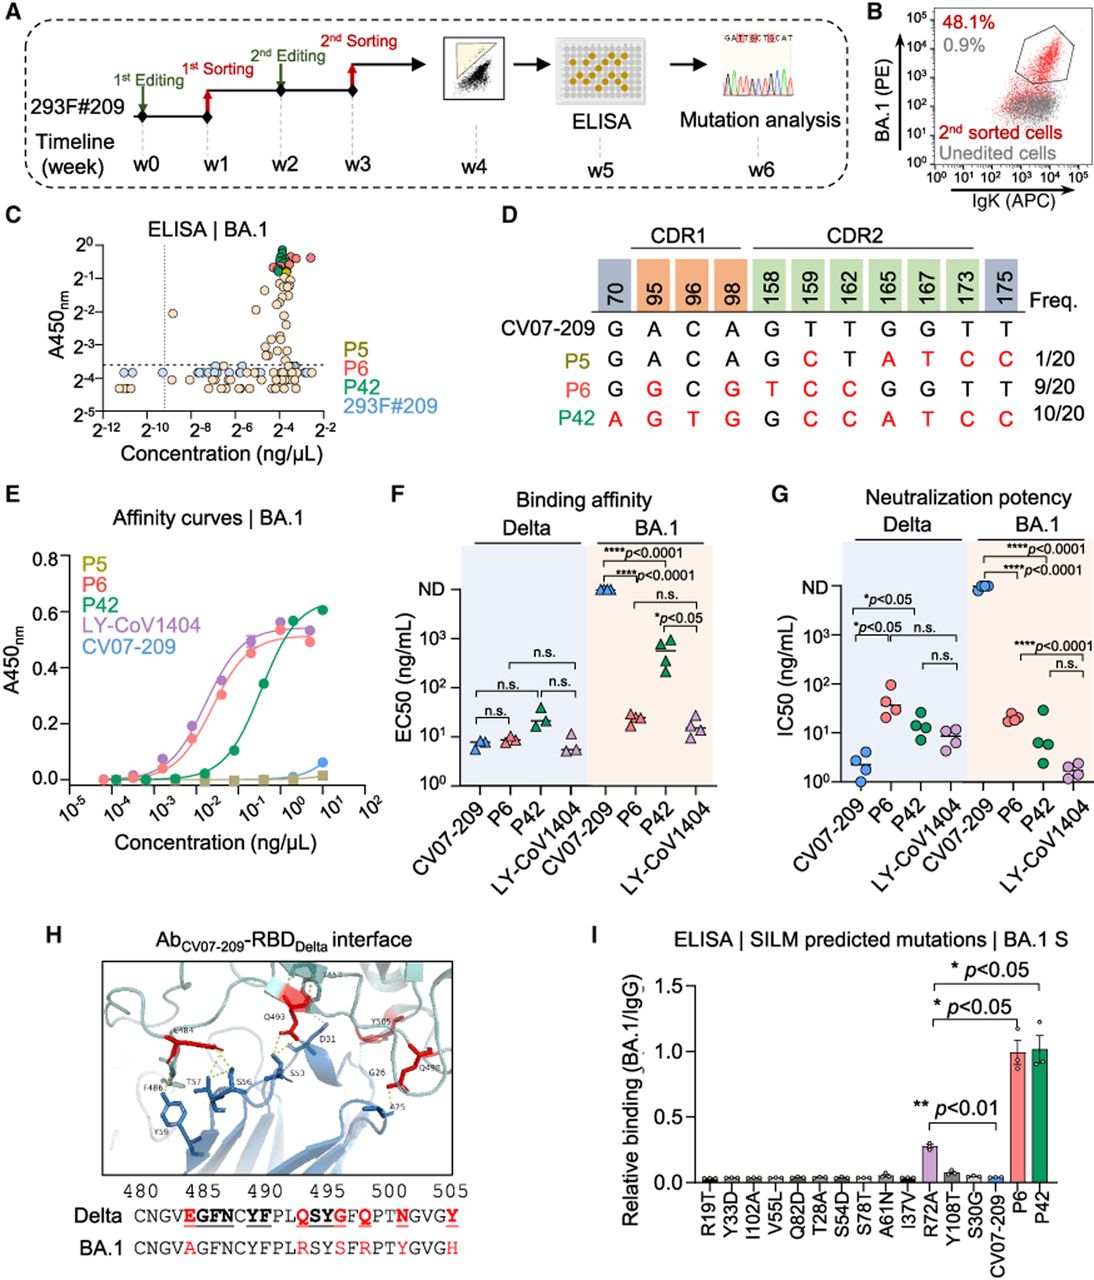
The evolution of CV07-209 directed by HAE1. (A) A schematic diagram showing the two-round evolution process. Affinity-matured single cells were sorted and cultured in 96-well plates, and their supernatants containing secreted antibodies were analyzed by ELISA. Cell clones exhibiting a strong response to BA.1 S protein underwent Sanger sequencing for mutation analysis. The timeline for this process is detailed below. (B) FACS plot showing the binding efficiency of 293F#209 cells after the second round of evolution. Cells were labeled with 1 ng/µL BA.1 S protein and anti-IgK antibody. Antigen-positive cells were gated relative to unedited 293F#209 cells (gray), with the corresponding cell proportions indicated in the top left. (C) ELISA results of supernatants from cell clones against BA.1 S protein. Antibody concentration (x-axis) and absorbance against BA.1 (y-axis) of these clones were detected simultaneously. The top 20 clones, including P5 (olive), P6 (red), and P42 (green) are highlighted. Wild-type 293F#209 cells (blue) were detected as a negative control. (D) Substitutions in P5, P6, and P42 compared with the CV07-209 wild-type gene, with the frequencies of occurrence in ELISA results listed on the right. (E) Representative binding affinity curves of purified antibodies against BA.1 S protein, as detected by ELISA. CV07-209 and P5 show no binding to BA.1, whereas P42 and P6 exhibit efficient responses. Data are presented as mean ± SEM from three technical replicates. (F,G) Binding affinity (F) and neutralization potency (G) of eAbs compared to the wild-type CV07-209 and the positive control, LY-CoV1404. EC50 and IC50 values were calculated using GraphPad Prism software for nonlinear regression analysis, with each data point representing an individual biological replicate. Notably, a lower value of EC50 or IC50 indicates higher binding affinity and neutralizing activity. Values >10,000 ng/mL or those with unstable fits are considered as nondetectable (ND). Statistical analysis was performed using an unpaired two-tailed t-test, with P values indicated or noted as not significant (n.s.) if P > 0.05. (H) AlphaFold 3-predicted structure of CV07-209 (blue) bound to the Delta RBD (cyan). The amino acids interacted with CV07-209 are depicted below. Mutated residues in BA.1 RBD are shown in bold. (I) Relative binding efficiency of CV07-209 and its mutations predicted by SILM targeting BA.1 S protein. Data are presented as mean ± SEM with three independent replicates. Statistical analysis was performed using a paired two-tailed t-test, with P values indicated.