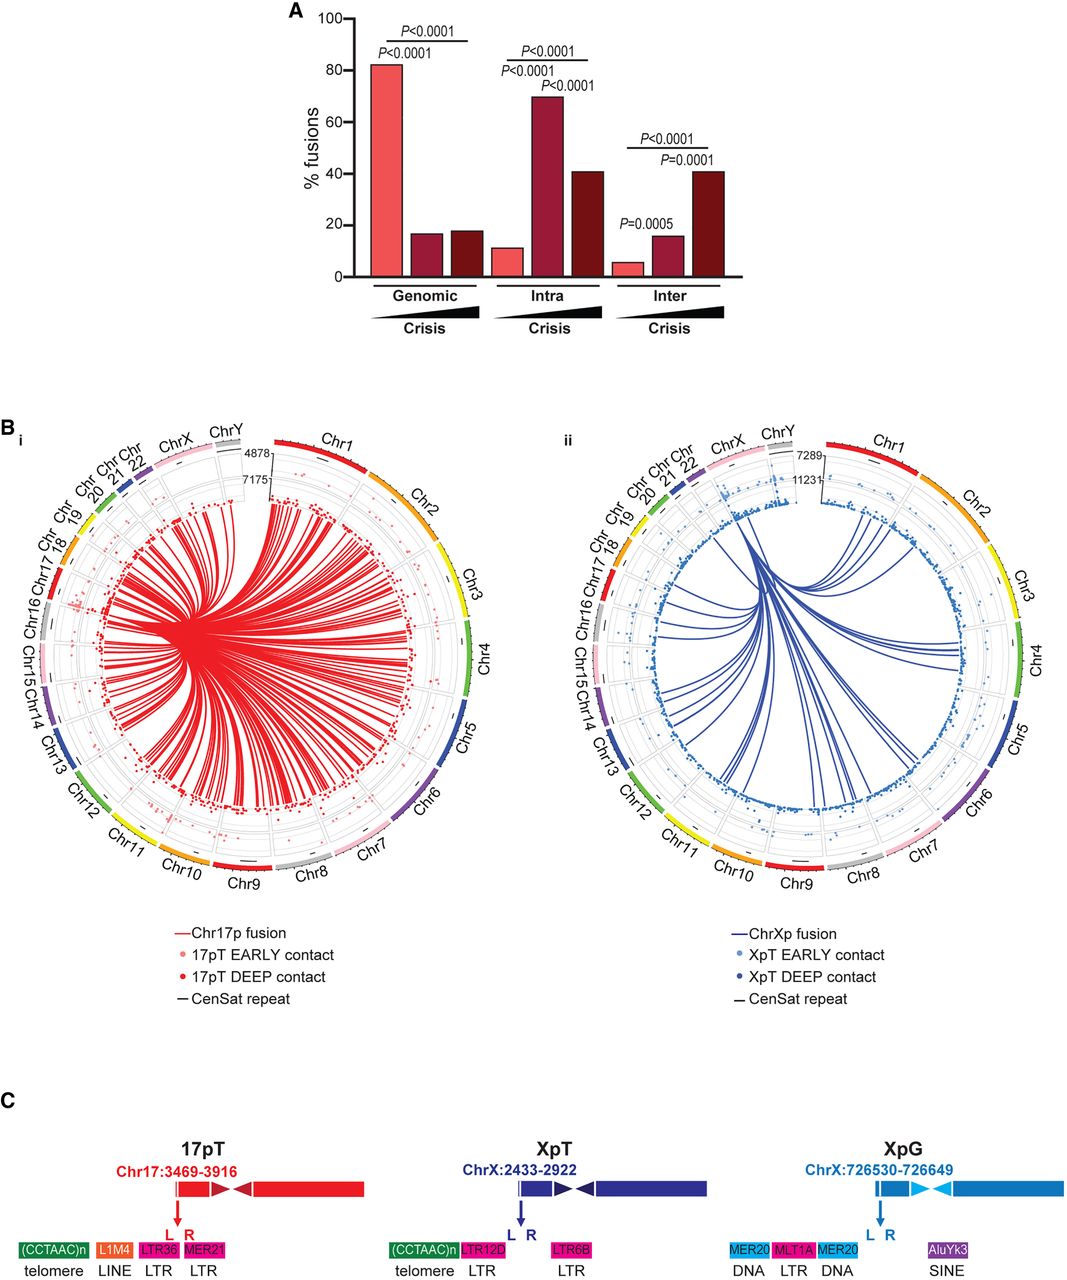
The changing profiles of telomere interactions and fusions during crisis transition. (A) The proportions of mapped telomere fusion sequences generated from Early (PD23) MRC5E6E7 crisis cells in this study that were classified as “genomic” (telomere fused to internal genomic locus), “intra” (intrachromosomal; telomeres of the same chromosome fused together) or “inter” (interchromosomal; telomeres of different chromosome fused together) are presented alongside comparable data for PD45 and PD49 MRC5E6E7crisis cells detailed in our former study (Liddiard et al. 2021). The black triangle and darker colored bars indicate the progression of replicative crisis. Statistical analyses employed the N − 1 χ2 method. (B) Circos plots (Yu et al. 2018) depicting all MRC5E6E7 Early- and Deep-crisis chromatin interactions with Chr17p (17pT; i) or ChrXp (XpT; ii) telomere-adjacent probes (17pT) determined using Capture-C presented as concentric perimeter tracks. Track height indicates signal intensity. Fusions between the Chr17p (i; red) or ChrXp (ii; blue) telomeres and genomic sites span the circle centers. Peripheral black lines underneath the chromosome identities demarcate the centromere and pericentromeric (CenSat) repeats. (C) Cartoons depicting the sequence contexts and human T2T-CHM13/hs1 genomic reference (Nurk et al. 2022) coordinates of the Chr17p (17pT), ChrXp (XpT), and internal genomic control (XpG) probes used in the Capture-C experiments. L and R denote the positions of the dual oligonucleotide probes at each location (for details, see Supplemental Table S1). Adjacent DNA repeats are represented by colored blocks. (LTR) Long terminal repeat, (LINE) long interspersed repeat, (SINE) short interspersed repeat, and (DNA) DNA repeat.