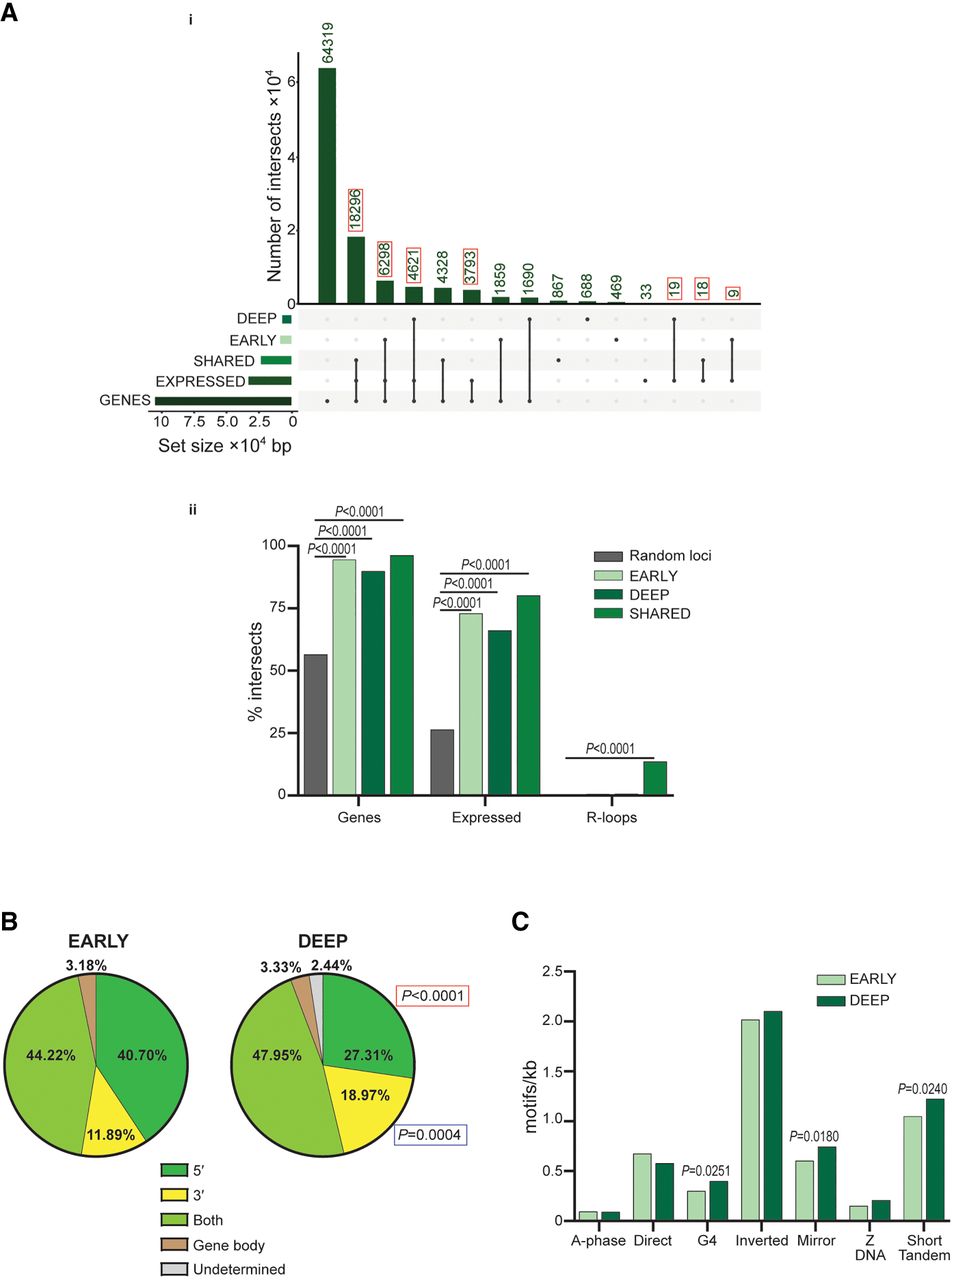
Correspondence of single-strand DNA (ssDNA) peaks with transcription and telomere-interacting sites in replicative crisis. (A, i) UpSet plot (Lex et al. 2014) depicting the overlaps (intersections) between MRC5E6E7 KAS-seq data sets and coding sequence (Genes) or genes expressed by MRC5E6E7 during crisis (Expressed) (Liddiard et al. 2021). (Early, Deep) Crisis stages, (Shared) ssDNA peaks common to both stages. Connected dots indicate the data sets included in each intersection, with vertical bars showing the number of elements in that intersection, enumerated above the bars. Key intersections are boxed in red. The data set (Set) sizes in nucleotide base pairs are depicted as horizontal bars. (ii) The proportions of genomic intervals associated with the specified Kas-seq ssDNA data sets or 1 million random genomic loci that intersect with genomic features are displayed. (Early, Deep) Crisis stages, (Shared) ssDNA peaks common to both stages, (Genes) coding sequence, (Expressed) genes expressed by MRC5E6E7 during crisis (Liddiard et al. 2021), and (R-loops) three-stranded nucleic acid structures. Differences were evaluated using the N − 1 χ2 method (P-values indicated). (B) Pie charts representing the fractions of Early- and Deep-crisis genes with ssDNA enriched at 5′ or 3′ locations or detected at both 5′ and 3′ ends or throughout the entire gene body. (Undetermined) Negligible ssDNA signal. The results of N − 1 χ2 comparisons of the 5′ and 3′ ssDNA gene enrichments are denoted next to the Deep-crisis chart. (C) The 5 kb genomic sequence extending from the 3′ termini of genes with prevailing 3′ ssDNA signal was assessed for presence of putative non-B DNA repeat motifs (x-axis; defined by Advanced Biomedical Computational Science [ABCS]) (Cer et al. 2012). Incidence rates (number of motifs per kilobase of input DNA) were compared for Early- and Deep-crisis samples, and the P-value for the incidence rate ratio is indicated. (G4) G-quadruplex repeats.