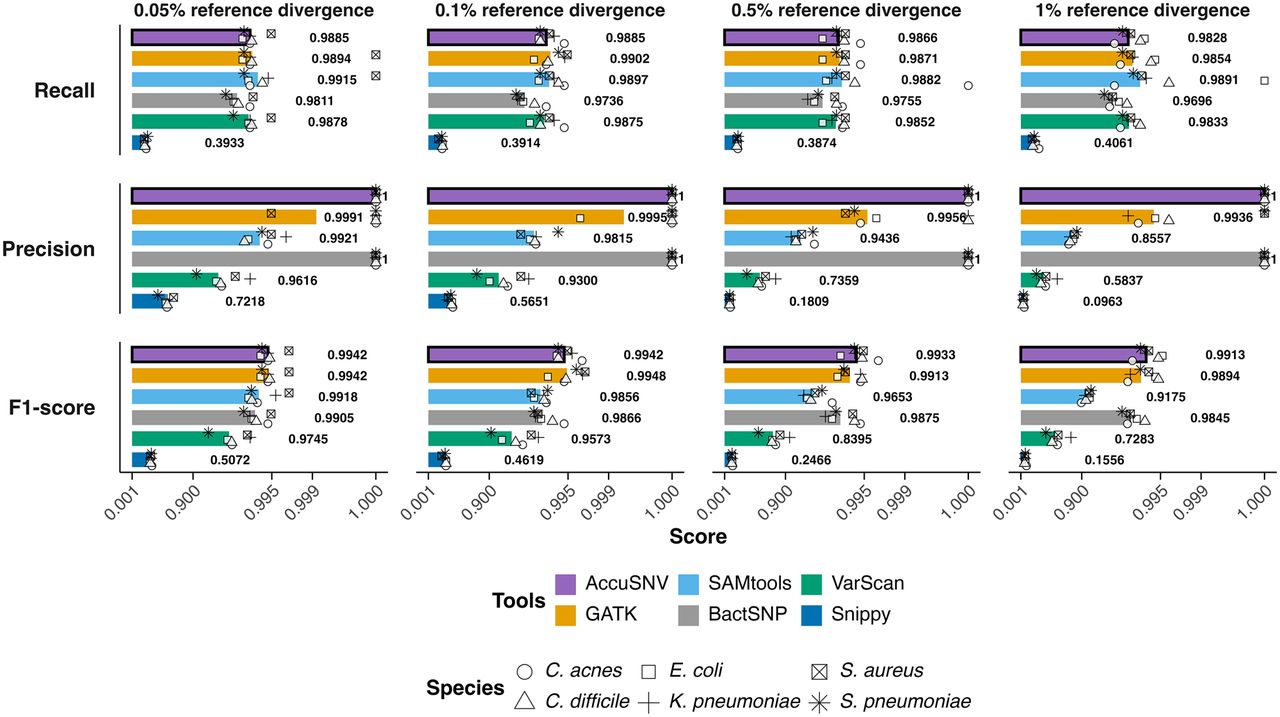
Figure 4.
AccuSNV maintains high accuracy on large and noisy simulated data sets. Performance comparison of six SNV-calling tools across four reference divergence levels. Axes use a transformed scale (−log10(1.0001 − x)) to enhance visualization in the higher range (0.9 to one). Shapes represent species, and colors represent tools. Panels show average recall (top), precision (middle), and F1 score (bottom) across all species. AccuSNV bars are highlighted with a black outline.