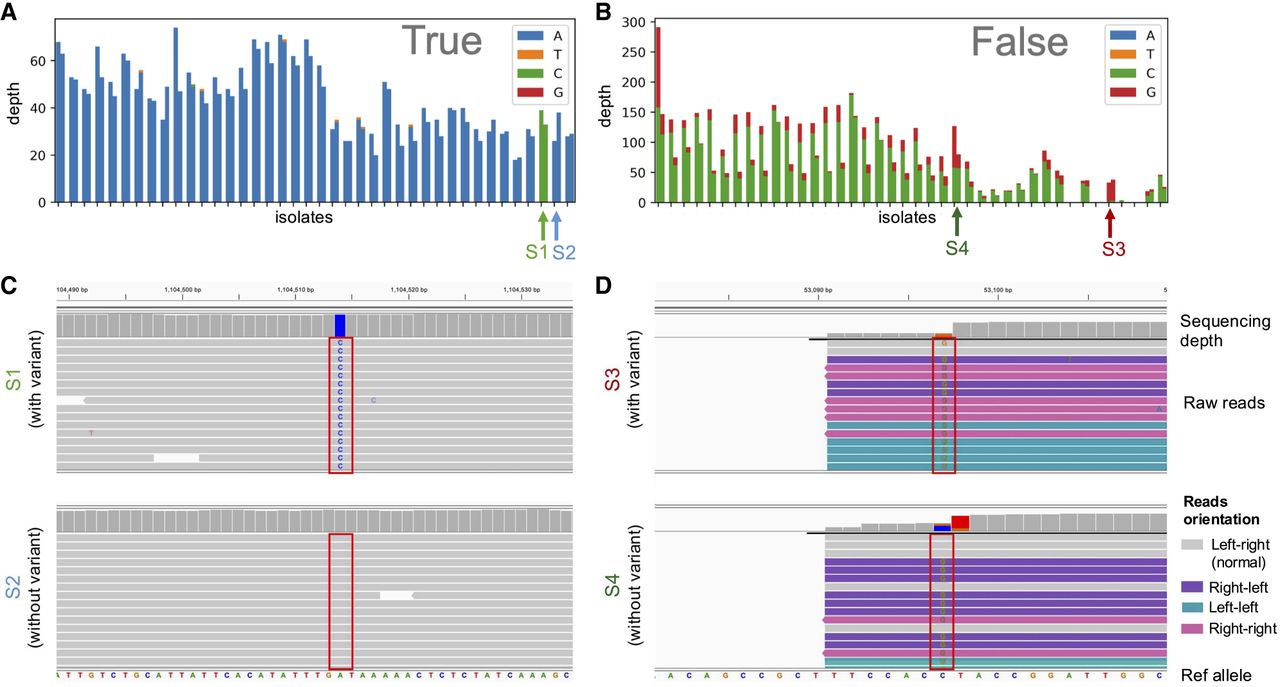
False SNVs arising from alignment errors are detectable from across-sample patterns. (A,B) Bar charts show sequencing depth across isolates for an example true SNV (A) and a false SNV (B) from real-world clinical data, with each pair of bars representing reads aligned to the forward and reverse strands for a single isolate, colored by nucleotide supported. Arrows indicate two randomly selected isolates (S1, S2 for the true SNV; S3, S4 for the false SNV) that are shown in C and D. (C,D) Integrative Genomics Viewer (IGV) views of the selected representative isolates S1, S2 (C) and S3, S4 (D) carrying either the major or alternative allele for the true and false SNV, respectively. The candidate SNV position is highlighted by red boxes, with the reference allele shown at the bottom of the figure. In panel D, the false positive arises from systematic mismapping of reads to this genomic position in both samples. The presence of a nearby structural variant results in the preferential recruitment of erroneous reads, leading to a variant call in the absence of sufficient reference allele support. Reads are colored by pair orientation. Only a left–right orientation (with the upstream read on the forward strand and downstream read on the reverse strand) is considered normal; abnormal orientations often indicate alignment errors or structural variants.