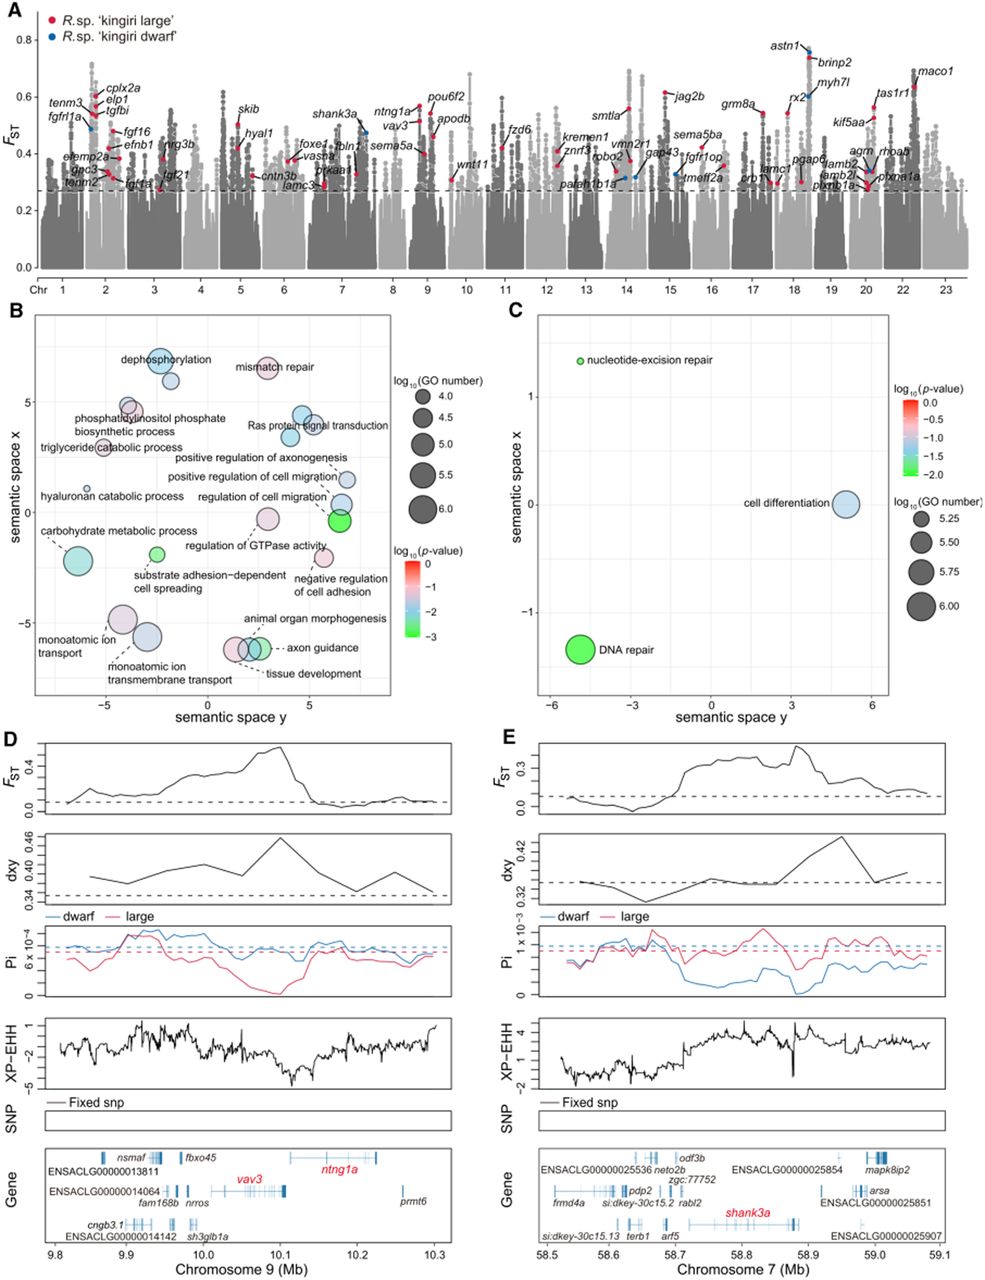
Selection analyses of the sympatric large and dwarf species of Rhamphochromis in Lake Kingiri. (A) Manhattan plot of the pairwise fixation index (FST) between Rhamphochromis sp. “kingiri large” and Rhamphochromis sp. “kingiri dwarf,” with selected genes in Rhamphochromis sp. “kingiri large” in red and selected genes in Rhamphochromis sp. “kingiri dwarf” in blue. The dashed gray line represents the up 5% FST threshold of 0.27. (B,C) GO scatterplots constructed using REVIGO for all the GO terms and genes identified as selected genes in Rhamphochromis sp. “kingiri large” (B) and genes identified as selected genes in Rhamphochromis sp. “kingiri dwarf” (C). Bubble size indicates the relative frequency of the GO terms and bubble color represents log10 P-values (smaller values indicate lower P-values). (D,E) Selective sweep on Chromosome 9 (9.8 to 10.3 Mb; D) and selective sweep on Chromosome 7 (58.5 to 59.1 Mb; E). The putative sweep region is validated by FST, Dxy, Pi, and XP-EHH test. Horizontal dashed lines represent the genome-wide means for the corresponding parameters. Gene annotations in the sweep region and SNPs nearly fixed for derived alleles are indicated at the bottom.