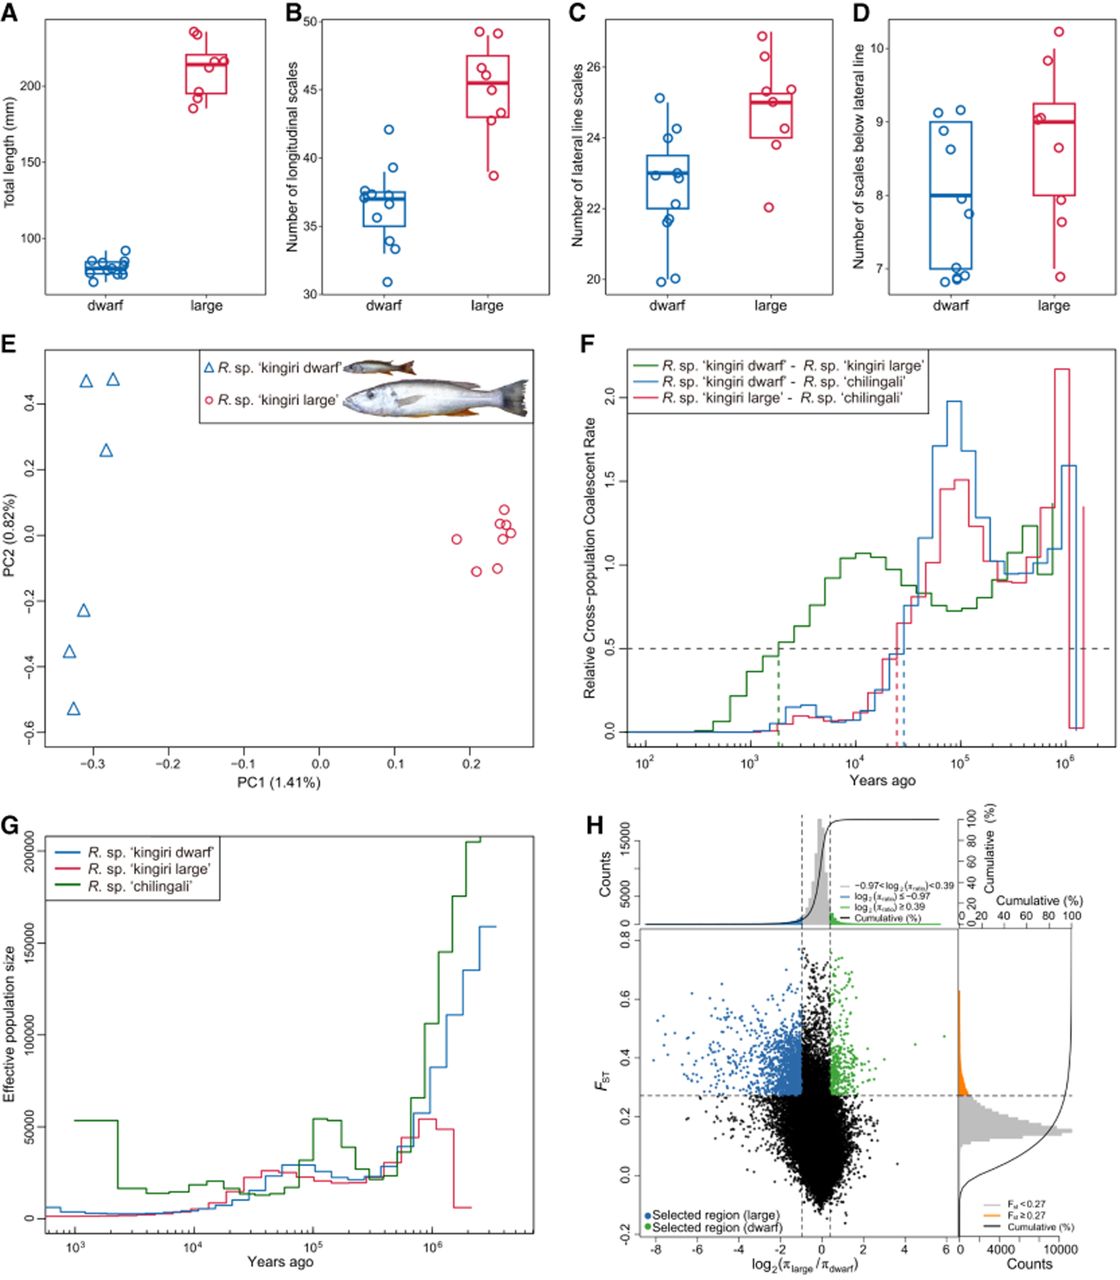
Morphological and genomic divergence between sympatric dwarf and large Rhamphochromis species in Lake Kingiri. (A–D) Relative to Rhamphochromis sp. “kingiri large,” Rhamphochromis sp. “kingiri dwarf” has smaller total length (A), fewer longitudinal scales (B), fewer lateral line scales (C), and fewer scales below the lateral line (D). (E) Principal component analysis for all Lake Kingiri Rhamphochromis using whole-genome SNP data. (F) MSMC2 cross-coalescence between Rhamphochromis sp. “kingiri dwarf” and Rhamphochromis sp. “kingiri large” individuals (green line), and between Lake Kingiri Rhamphochromis species and Rhamphochromis sp. “chilingali” (blue and red lines). Dotted lines indicate the split time for each population pair (relative cross-coalescence rates = 0.5). (G) Demographic history and effective population size of the two Rhamphochromis species in Lake Kingiri (blue and red lines) and the species from Lake Chilingali (green line) using MSMC2. (H) Distribution of log2 ratio of nucleotide diversity (π; πlarge/πdwarf) and FST of 50 kb windows with 10 kb steps. Colored data points indicate selected windows for Rhamphochromis sp. “kingiri large” (in blue) and R. “kingiri dwarf” (in green). Vertical lines reflect the 5% left and right tails of the log2(πlarge/πdwarf) distribution (thresholds –0.97 and 0.39, respectively). The horizontal dashed line reflects the top 5% of windows in the FST distribution (threshold FST = 0.27).