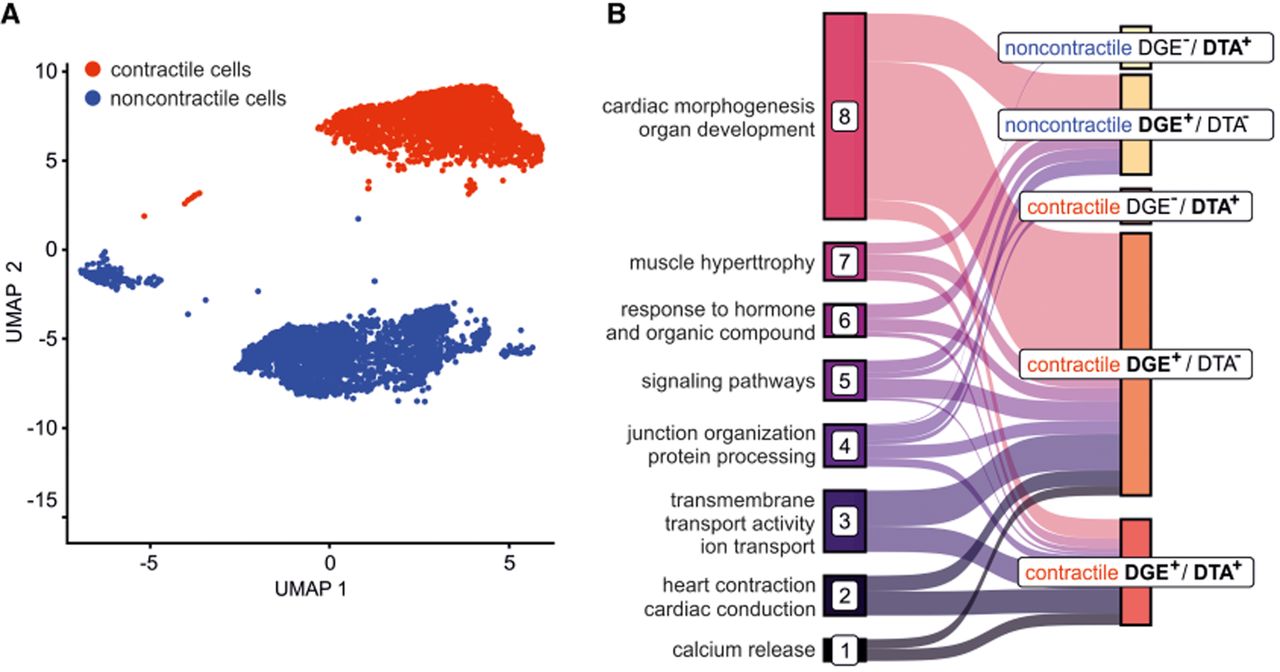
Figure 7.
Cell type specificity of biological processes enriched in DGE and DTA displaying genes. (A) UMAP embedding of D30 with contractile iCM (red) and noncontractile (blue) cells. (B) The Sankey plot of the enriched GO biological process pathway clusters and their relation to cell–gene regulation-type-specific groups.