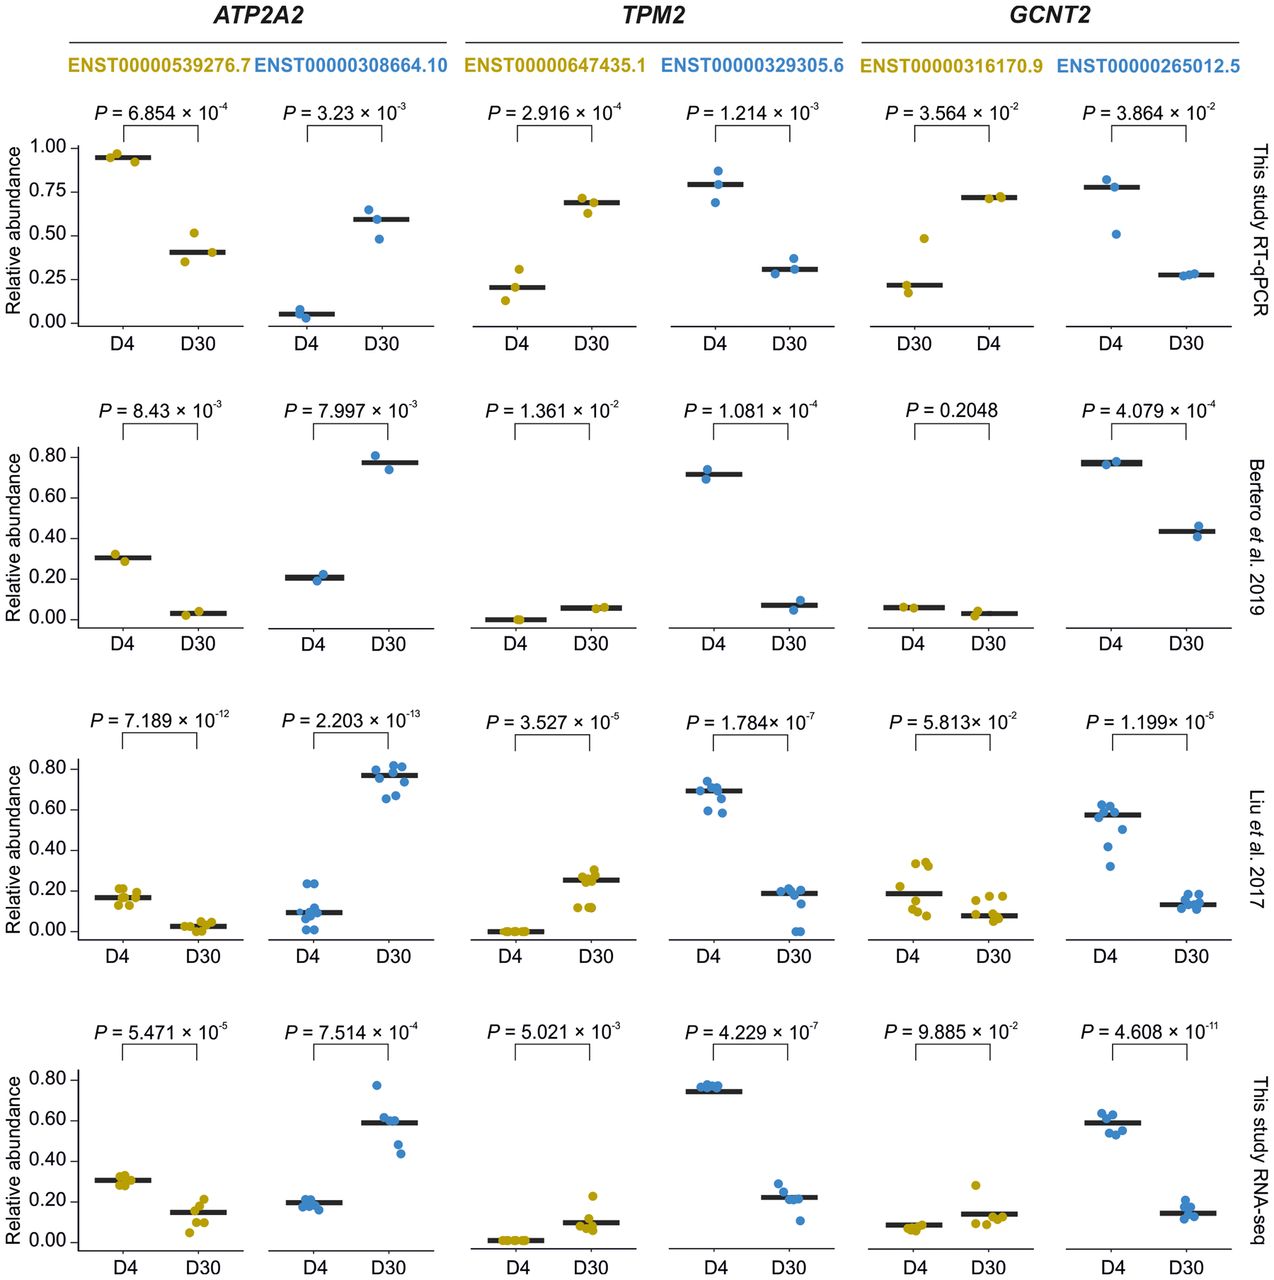
Figure 3.
Replication and validation of DTA. Box plots showing the relative abundance of RNA isoforms evaluated with RT-qPCR (n = 3) and three RNA-seq data sets of iPSC-to-iCM differentiation: Bertero et al. (2019) (n = 2), Liu et al. (2017) (n = 8), and this work (n = 6). The black bars depict the mean value. Reference gene used: ACTB. Statistical significance was calculated with a Student's t-test for n > 5 and an unpaired two-tailed Welch's t-test for n < 5. (D4, D30) Days of iPSC-to-iCM differentiation.