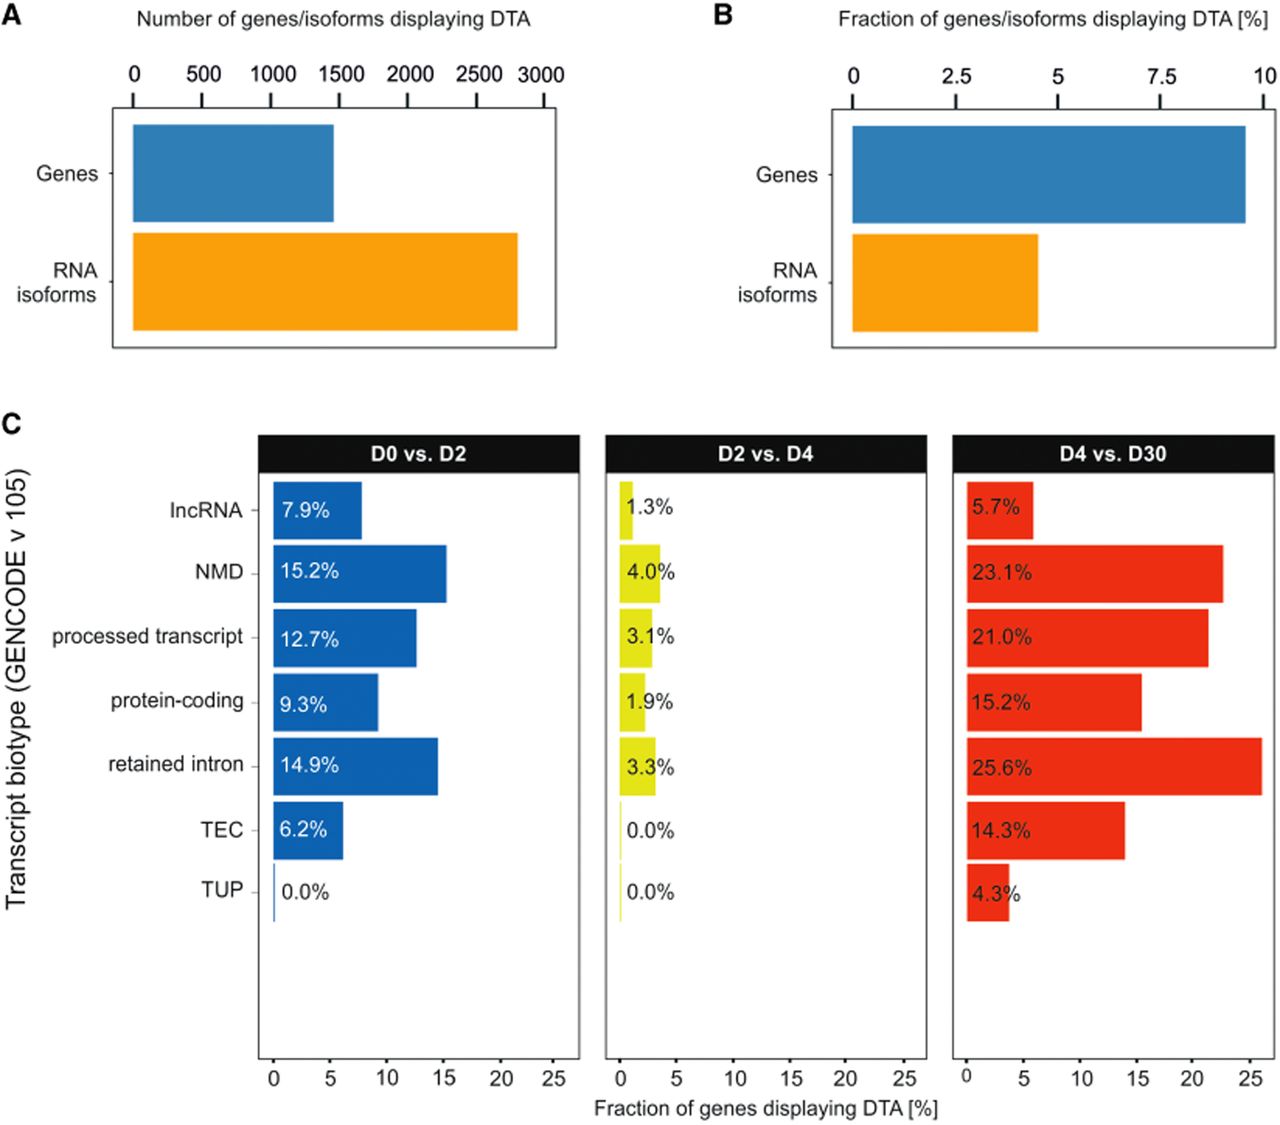
Figure 2.
Quantification and biotype distribution of genes and isoforms undergoing DTA. (A) Total number of genes and RNA isoforms displaying DTA. (B) Fraction of genes and RNA isoforms displaying DTA identified across a iPSC-to-iCM differentiation time course. (C) Fraction of genes displaying DTA, grouped by transcript biotype (Ensembl release 115 taxonomy), during iPSC-to-iCM differentiation. (D0, D2, D4, D30) Days of differentiation, (lncRNA) long noncoding RNA, (NMD) nonsense mediated decay, (TEC) to be experimentally confirmed, and (TUP) transcribed unprocessed pseudogene.