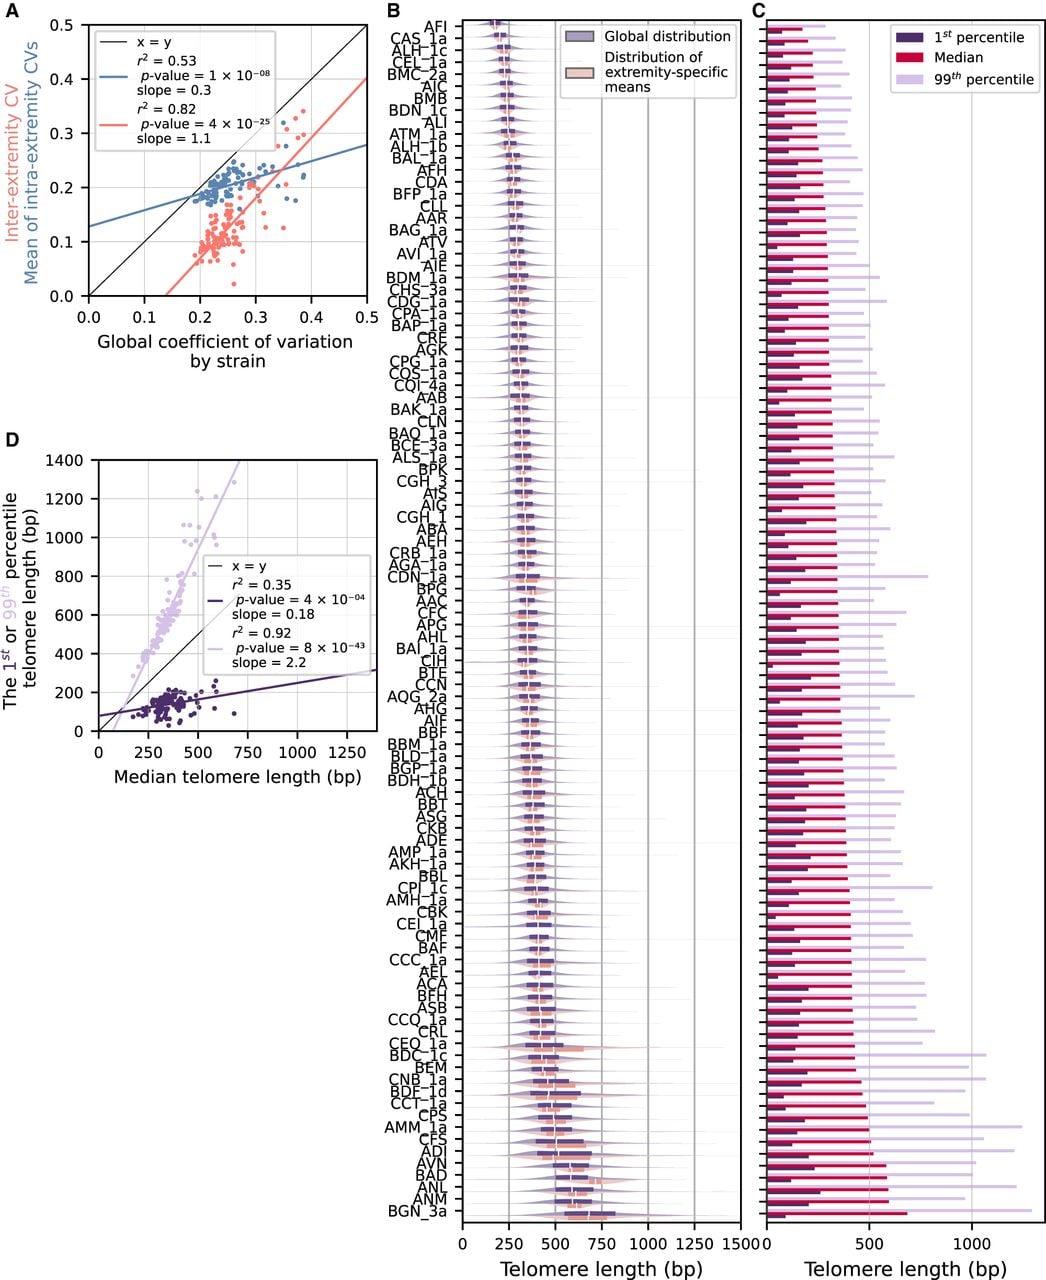
Contributions to global TL variations. (A) The mean of extremity-specific TL distribution CVs, reflecting the average within-extremity variation, is plotted against the global TL distribution CV as a blue dot for each strain. The CV of the distribution of extremity-specific TL means, reflecting interextremity variation, is plotted against the global TL distribution CV as a red dot for each strain. (B) Global TL distribution (blue; upper part of each graph) and distribution of extremity-specific TL means (salmon; lower part of each graph) are displayed for all strains, ranked by increasing median TL. A boxplot representing 50% of the values is superimposed on the density plot. (C) Median and first and 99th percentiles of the global TL distribution are displayed for each strain. Strains are ordered by increasing median TL. (D) The first (purple) and 99th (mauve) percentiles of the global TL distribution for each strain are plotted against the median TL, and the linear regressions are shown.