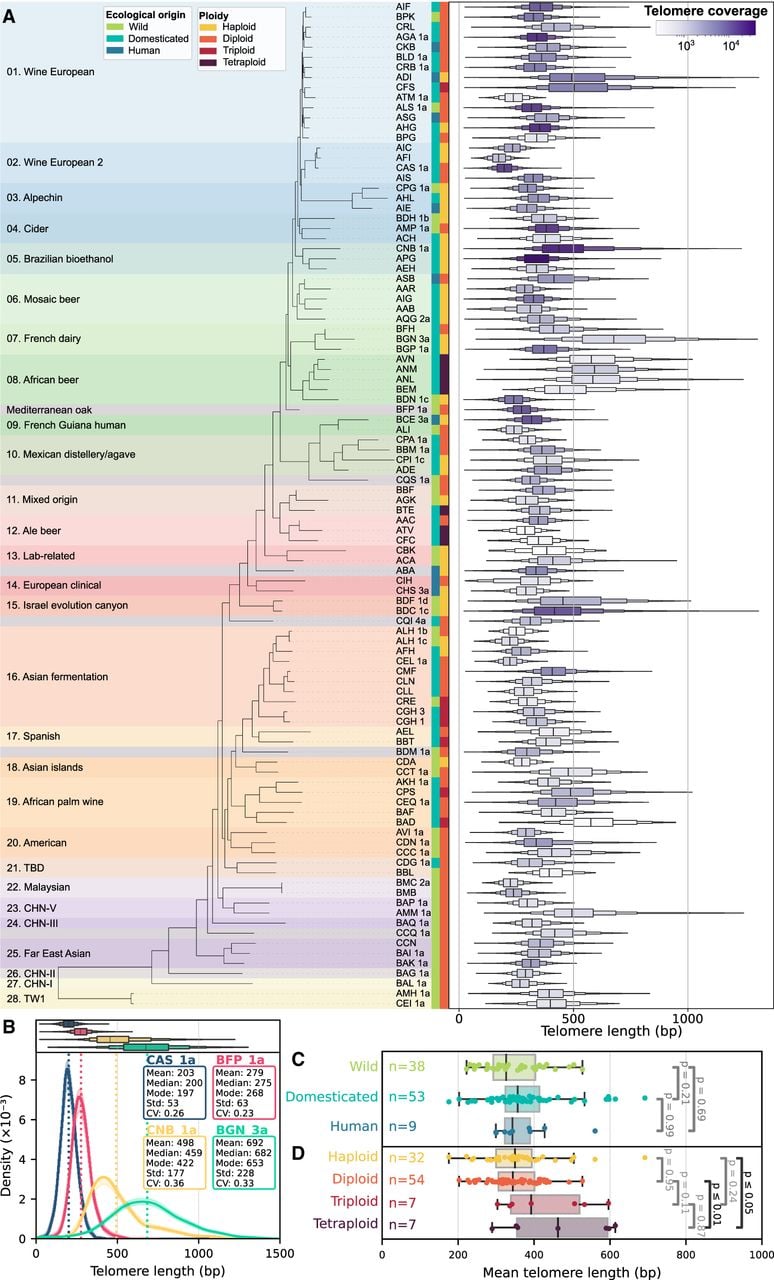
Figure 2.
Natural diversity of the TL distribution in S. cerevisiae. (A) Phylogenetic tree and clade classification from the work of O'Donnell et al. (2023). For each strain, the TL distribution is represented as a boxplot. (B) TL distributions for four strains, selected to illustrate the diversity in means and standard deviations. (C) Boxplots of the TL means of wild, domesticated, and human-associated strains. P-values from Tukey's HSD tests are shown (initial ANOVA test P-value = 0.22). (D) Boxplots of TL means of haploid, diploid, triploid, and tetraploid strains. P-values from Tukey's HSD tests are shown (initial ANOVA test P-value = 0.003). Nonsignificant differences are shown in gray; significant ones, in black.