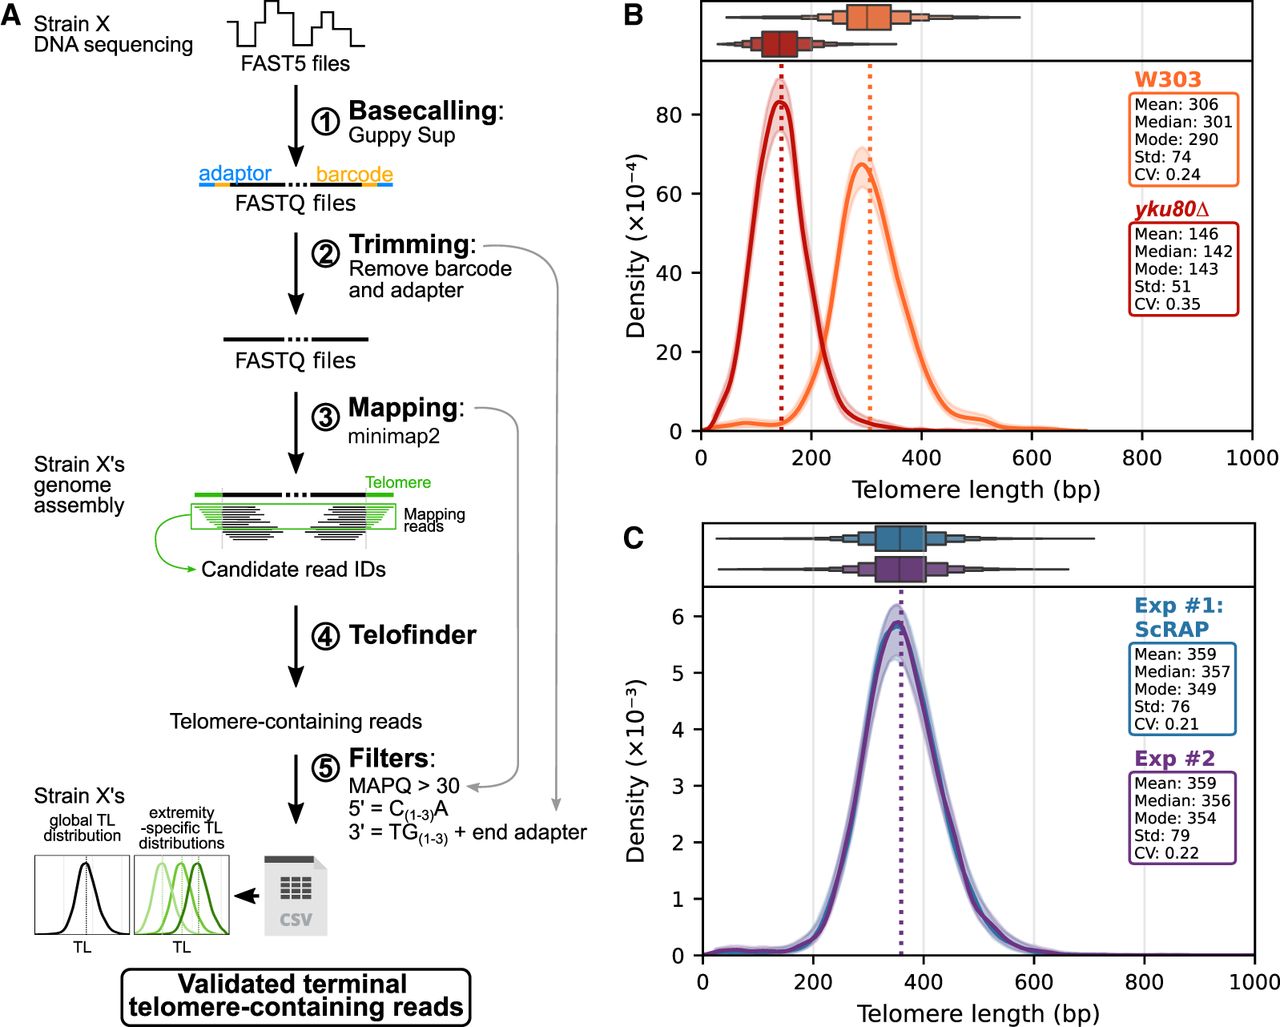
High-resolution TL distribution from ONT sequencing. (A) Bioinformatic pipeline to retrieve TLs from single-molecule ONT sequencing. The raw electric signal from nanopores was basecalled using the super accuracy mode of Guppy (step 1). Barcodes and adapters were then removed by Porechop (step 2), and candidate sequences mapping to the telomere regions of the corresponding genome assembly were selected (step 3). The initial reads corresponding to these candidates were scanned for telomere sequences using Telofinder (step 4) and validated as telomeric reads if compliant with specific quality filters (step 5), including a mapping quality (MAPQ) threshold and a test for the presence of an adapter at the 3′ end of the molecule for TG(1–3) sequences (gray arrows). Global and extremity-specific TL distributions are then computed. (B) TL distributions of the wild-type W303 strain and its yku80Δ derivative, represented by a boxplot (top graph; successive box edges indicate 50%, 75%, 87.5%, 93.75%, etc., of the data) or by its density (bottom graph), obtained from ONT sequencing using the bioinformatic analysis pipeline described in A. The shaded area indicates the 95% confidence interval of the sampling noise, inferred from bootstrapping. The mean value is indicated by the dotted line. The detailed metrics are shown in the insets. (C) TL distribution of strain AHG, using data from O'Donnell et al. (2023) (Exp #1) and from a new sequencing (Exp #2). Same representation as in B.