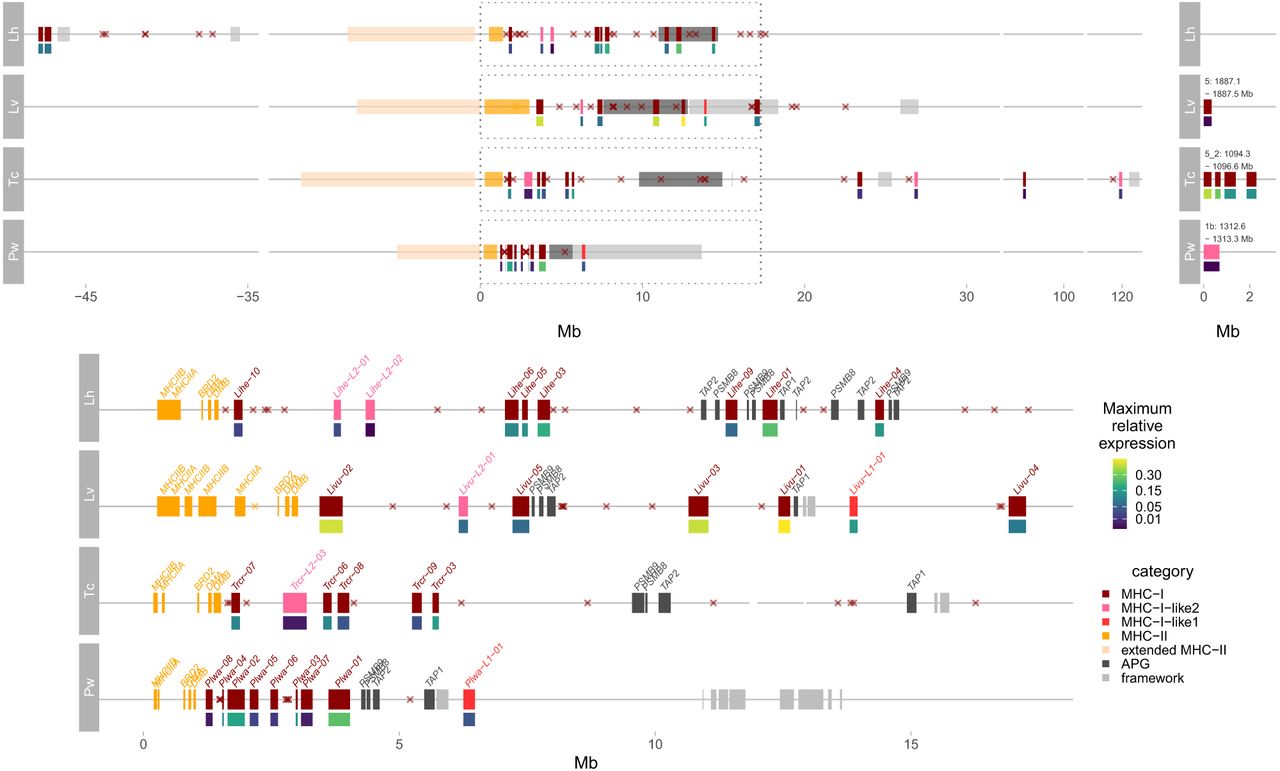
Genes in the MHC region(s). Upper left: Genes in the genomic regions corresponding to those in Figure 2; APG, MHC-II, extended class II, and framework genes are indicated as colored blocks; MHC-I genes are shown individually; the width of the rectangles indicates gene lengths; filled rectangles below MHC-I genes show the maximum relative expression. Coordinates were rearranged so that the start/end of COL11A2, the extended class II gene adjacent in genomes to class II, is given coordinate 0. Pseudogenes are marked with asterisks. Upper right: MHC-I/MHC-like (if any) genes located outside the main MHC region. Lower part: The zoomed in “core” MHC region indicated with dashed rectangles in the upper plot. MHC-I, MHC-II and APG are marked and labeled individually, with the width of rectangles corresponding to gene lengths. Maximum relative expression: the maximum fraction of total MHC-I expression (FPKM) attributable to a sequence across all RNA-seq libraries from postmetamorphic individuals examined within a species (Supplemental Tables S3, S4).