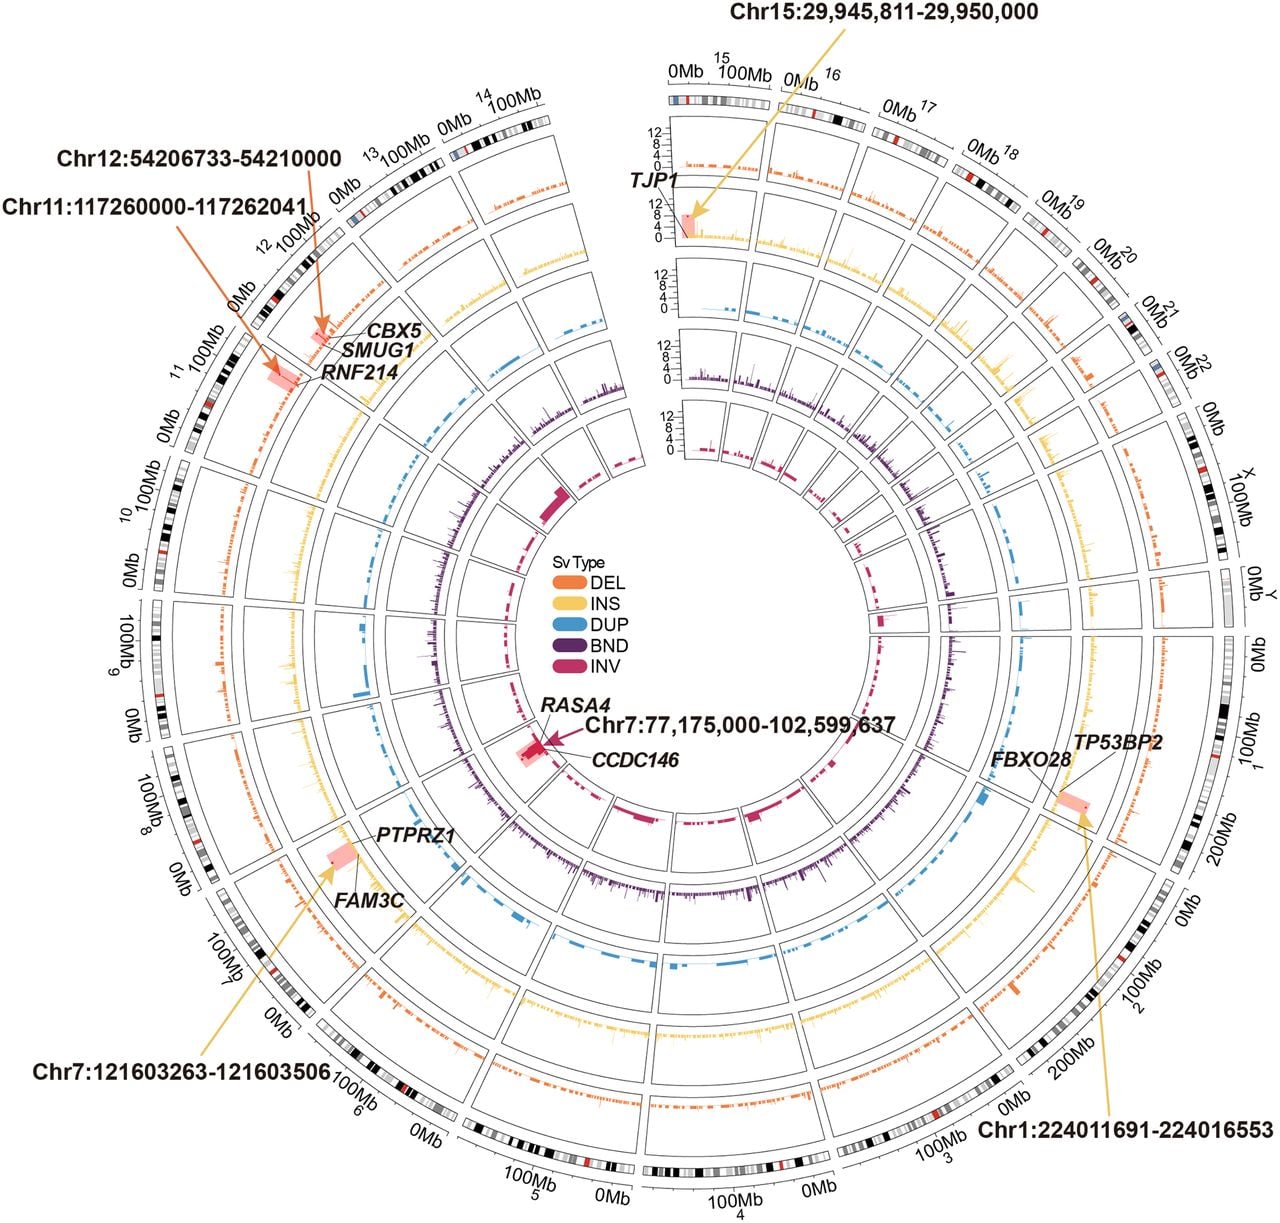
Figure 5.
Circos plot of genome-wide sample enrichment. The tracks in the figure represent the enrichment of different SV types in the samples, from the innermost to the outermost being INV, BND, DUP, INS, and DEL. The plot highlights regions with the top two sample counts for INS and DEL that may affect genes, the top three regions for INV sample counts, and regions intersecting with those reported in previous studies.