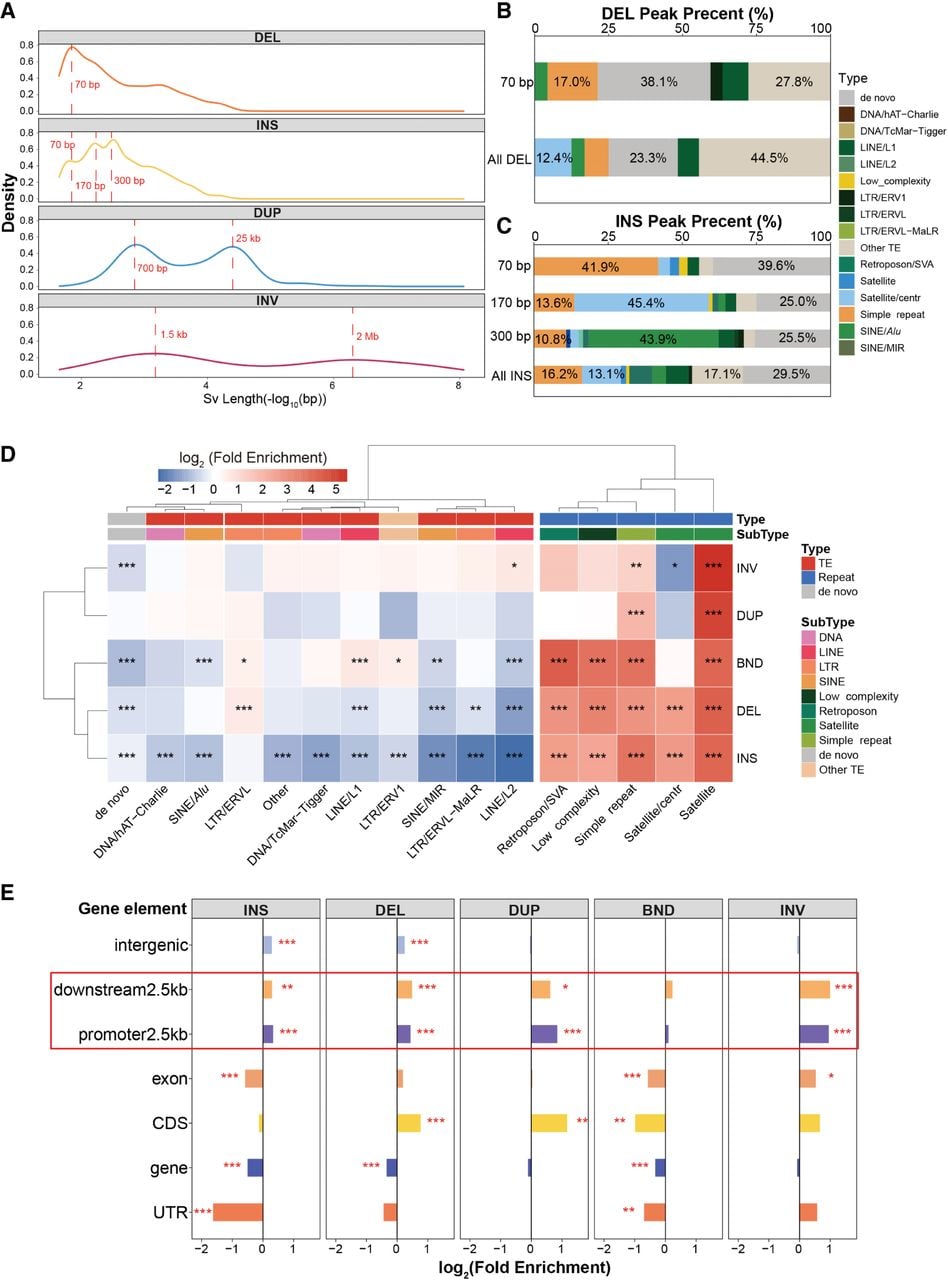
Overview of SV length and site enrichment. (A) Length distribution plot for different SV types. From top to bottom are DEL, INS, DUP, and INV, with red dashed lines marking the peaks for each SV type. (B) Stacked bar chart of sequence annotation proportions at DEL peaks. (C) Stacked bar chart of sequence annotation proportions at INS peaks. (D) Heatmap of somatic SVs site enrichment in repeat regions. Each row represents a different SV type, and each column represents a different repeat region type, with color intensity indicating log2(fold enrichment). Repeat regions are categorized into transposable elements region (TE), repeat region (Repeat), and nonrepetitive regions (de novo). (E) Bar chart of somatic SVs site enrichment for gene elements. The x-axis represents log2(fold enrichment), the y-axis represents gene element names, and facets represent different SV types. Fisher's exact test, (*) P-value < 0.05, (**) P-value < 0.01, (***) P-value < 0.001.