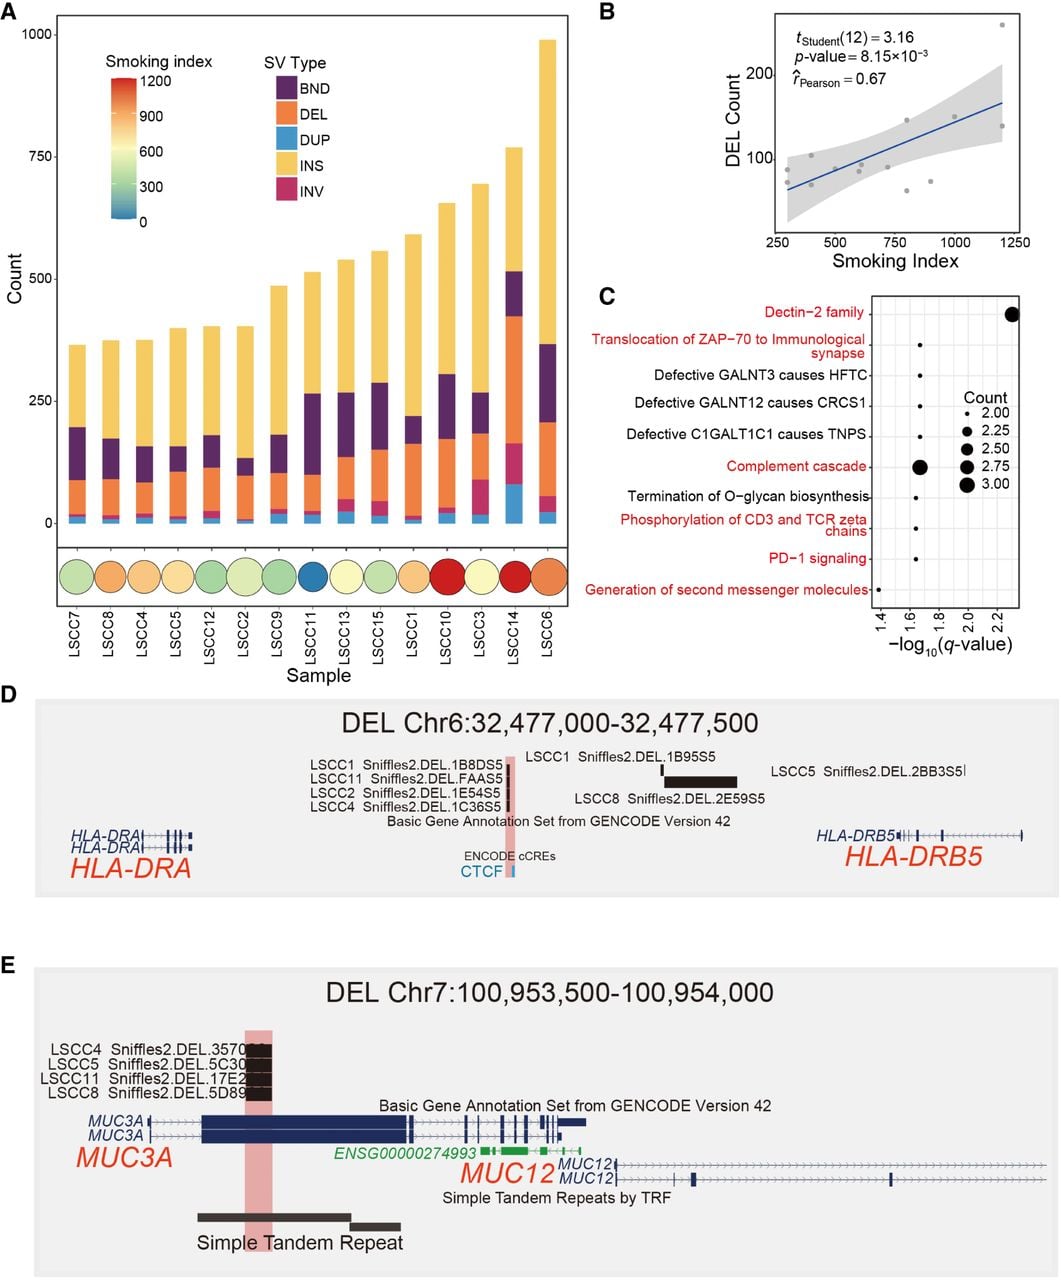
Relationship between somatic DEL and tobacco exposure. (A) Stacked bar chart of somatic structural variation counts and smoking index distribution. The upper stacked bar chart shows the number of different SVs for each sample, and the lower bubble chart shows the smoking index for corresponding samples, in which higher indices are represented by redder colors. (B) Correlation plot of somatic DEL counts and smoking index. The x-axis represents the smoking index, and the y-axis represents the number of DEL, with degrees of freedom, P-value, and Pearson correlation coefficient marked on the plot. (C) Reactome pathway enrichment plot for genes affected by common DEL in multiple samples from smokers (Q-value < 0.05). The x-axis represents −log10(Q-value), and the y-axis represents the names of enriched pathways, with immune-related pathways highlighted in red. The size of the circles indicates the number of enriched genes. (D) Browser plot of somatic DELs (Chr 6: 32,477,000–32,477,500) illustrating the following epigenomic signals: sample DEL location, ENCODE-annotated gene transcript, and candidate cis-regulatory elements (cCREs) predicted by ENCODE. (E) Browser plot of somatic DELs (Chr 7: 100,953,500–100,954,000) illustrating the following epigenomic signals: sample DEL location, ENCODE-annotated gene transcript, and simple tandem repeats identified by TRF.