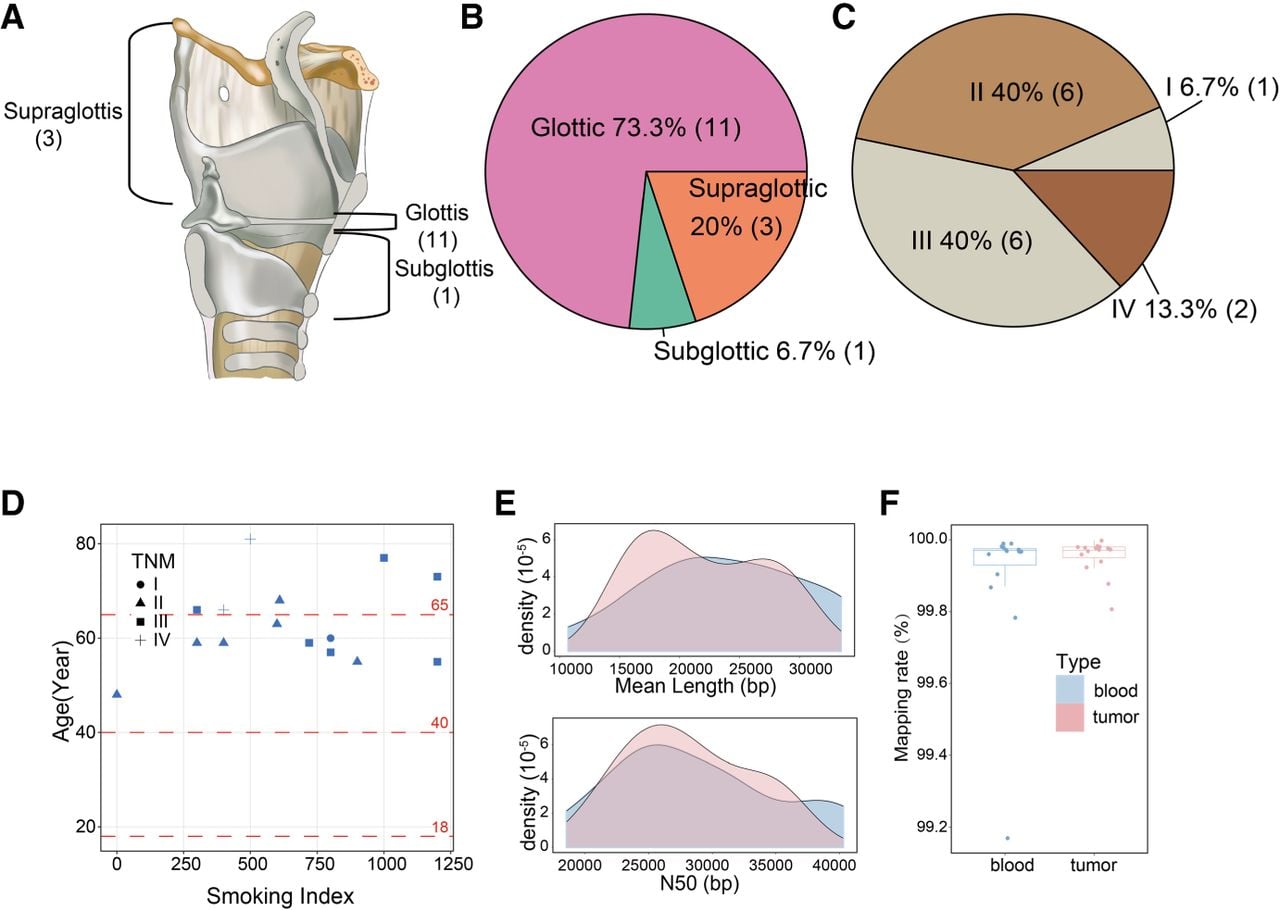
Overview of pathological information and sequencing data. (A) Display of sampling sites for LSCC. There are three cases of supraglottic type, 11 cases of glottic type, and one case of subglottic type. (B) Pie chart of the proportion of sampling sites for LSCC. (C) Pie chart of the proportion of TNM staging for LSCC patients. (D) Pathological scatter plot for LSCC patients. The x-axis represents the smoking index of patients (calculated as the number of cigarettes per day × smoking years), the y-axis represents patient age, and the shape of the points indicates TNM staging. (E) Read-length distribution plot of nanopore sequencing. The upper part shows the distribution of average read lengths (in base pairs) for tumor (pink) and blood (blue), and the lower part shows the N50 distribution for tumor and blood. (F) Box plot of read mapping rates. Blue represents blood, and pink represents tumor.