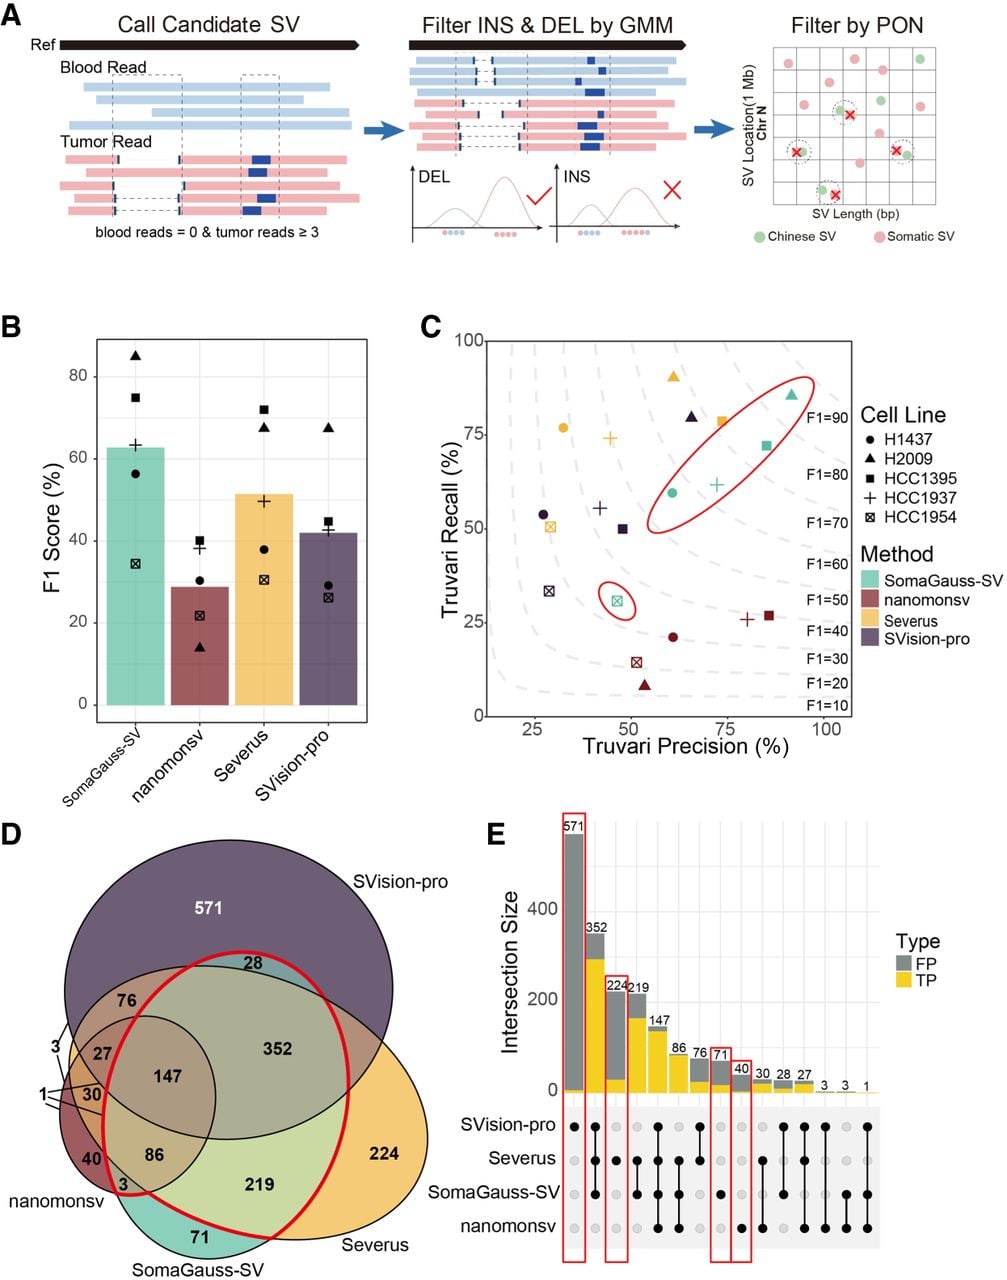
Overview and evaluation of somatic SV detection software. (A) Schematic of the SomaGauss-SV workflow, which consists of three main steps: (1) detection of candidate somatic SVs, screening of somatic SVs through a merge method; (2) filtering of insertions (INS) and deletions (DEL) using a Gaussian mixture model (GMM); and (3) filtering of SVs using data from the Chinese normal population. (B) Bar chart showing the F1-scores for different software. The height of the bars represents the average F1-score for each software, and different shapes of points indicate the F1-scores for different cell lines. (C) Contour plot of software evaluation. The x-axis represents precision, the y-axis represents recall, the contours in the plot represent F1-scores, and software and cell lines are distinguished by the color and shape, respectively, of the points. (D) Venn diagram of software detection results in the HCC1395 cell line. Numbers indicate the number of SVs in the intersections between software, and red lines indicate the intersections involving SomaGauss-SV with other software. (E) UpSet plot of true-positive (TP) proportions for different software in the HCC1395 cell line. Yellow indicates TP, gray indicates false-positive (FP), red boxes indicate the proportion of TP unique to each software, and black circles below indicate intersections between software.