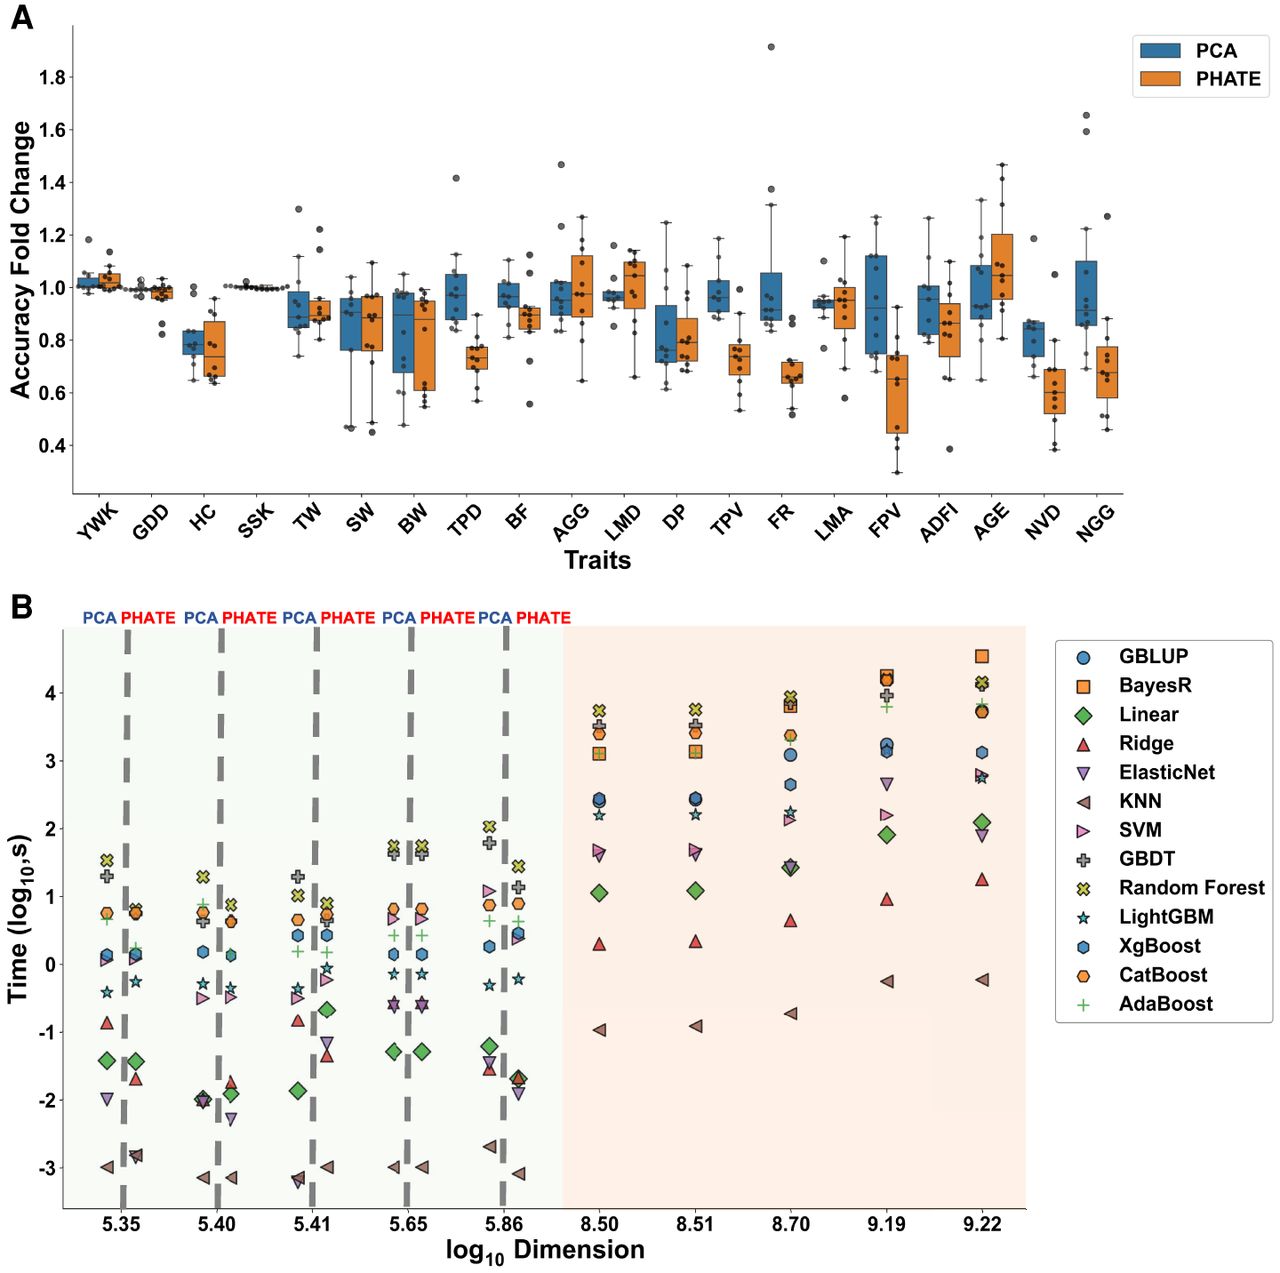
Changes in accuracy and time caused by dimensionality reduction. (A) Changes in accuracy following dimensionality reduction, with PCA represented in blue and PHATE represented in orange. The x-axis delineates various traits, and the y-axis indicates the multiplicative change in accuracy relative to the baseline accuracy obtained without dimensionality reduction. A value below one signifies that the accuracy of postdimension reduction is inferior to that of the original data set, whereas a value above one indicates an improvement. Each black point corresponds to a specific ML method, and each boxplot summarizes the distribution of accuracy changes across all ML methods applied to the corresponding trait. (B) Time comparison between different prediction methods. The y-axis denotes the logarithm of the computational duration in seconds. We calculated the logarithm of the product of the sample size and the number of SNP and plotted it on the x-axis. When the sample sizes and number of features for different traits were equal, their computational times were identical. The orange background indicates the original data set, which did not undergo dimension reduction, whereas the green background signifies the data set after dimension reduction. The PCA and PHATE results are represented on the left and right sides of the dotted line, respectively.