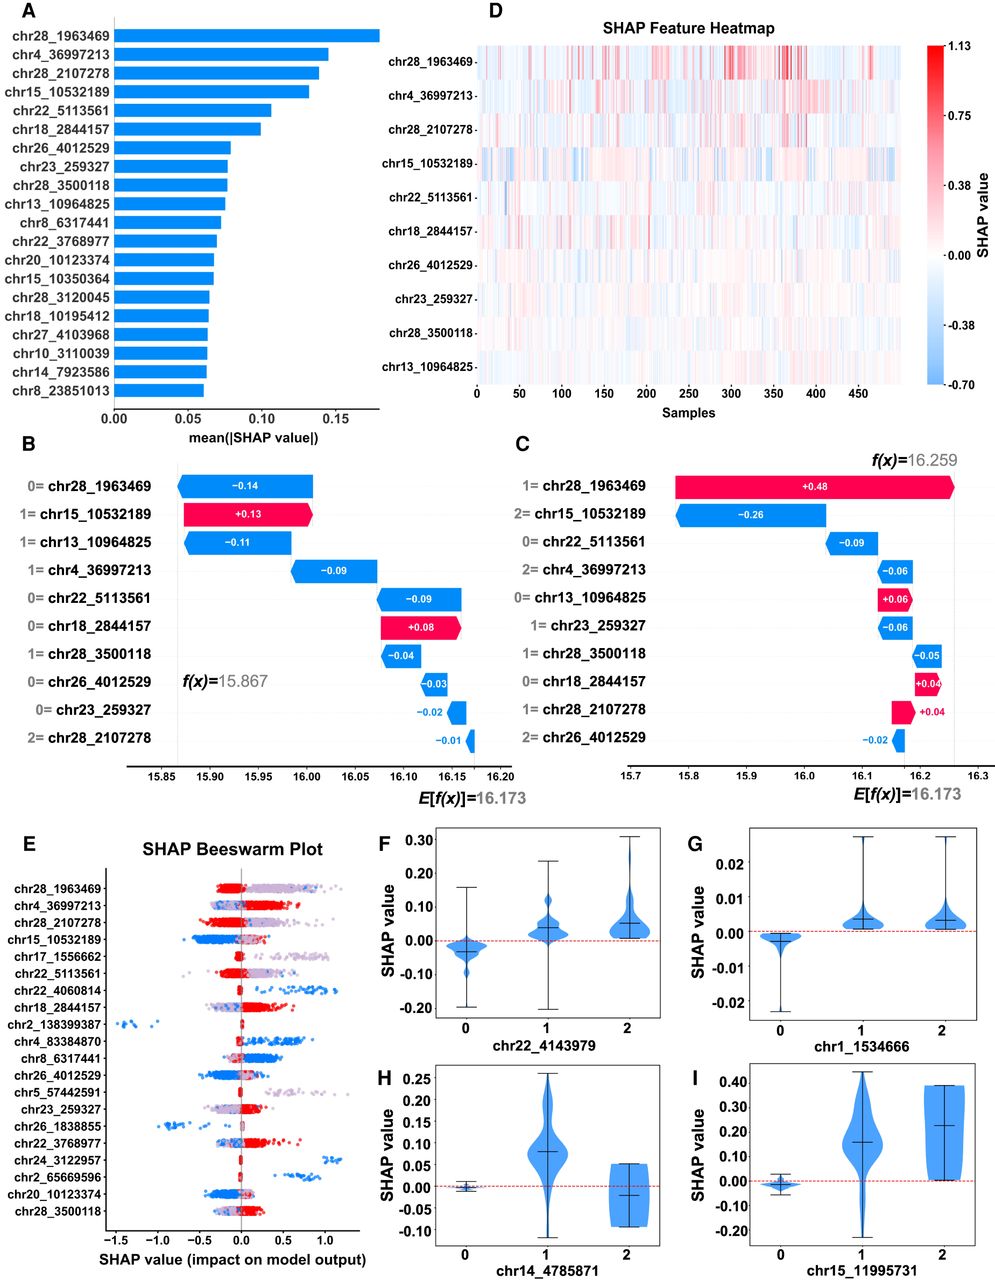
Interpretation of the SHAP model. (A) Importance-ranking plot of SNP features. (B,C) The single-sample feature waterfall plot illustrates the SHAP values on the x-axis, and the y-axis delineates various feature values. Values 0, 1, and 2 correspond to the three genotypes AA, Aa, and aa, respectively. E[f(x)] denotes the expected value across all the samples, whereas f(x) represents the predicted value for a specific sample. (D) Heat map illustrating the distribution of features across clustered samples. The x-axis corresponds to the 500 samples, and the y-axis denotes the features. (E) Characteristic attributes in SHAP are represented on a beeswarm plot, with each line corresponding to a specific SNP feature. Genotypes are represented by different colors: AA (zero; red), Aa (one; gray), and aa (two; blue). (F–I) The distribution of SHAP values characterizes different genetic effect patterns: additive (F), dominant (G), superdominant (H), and epistatic effects (I).