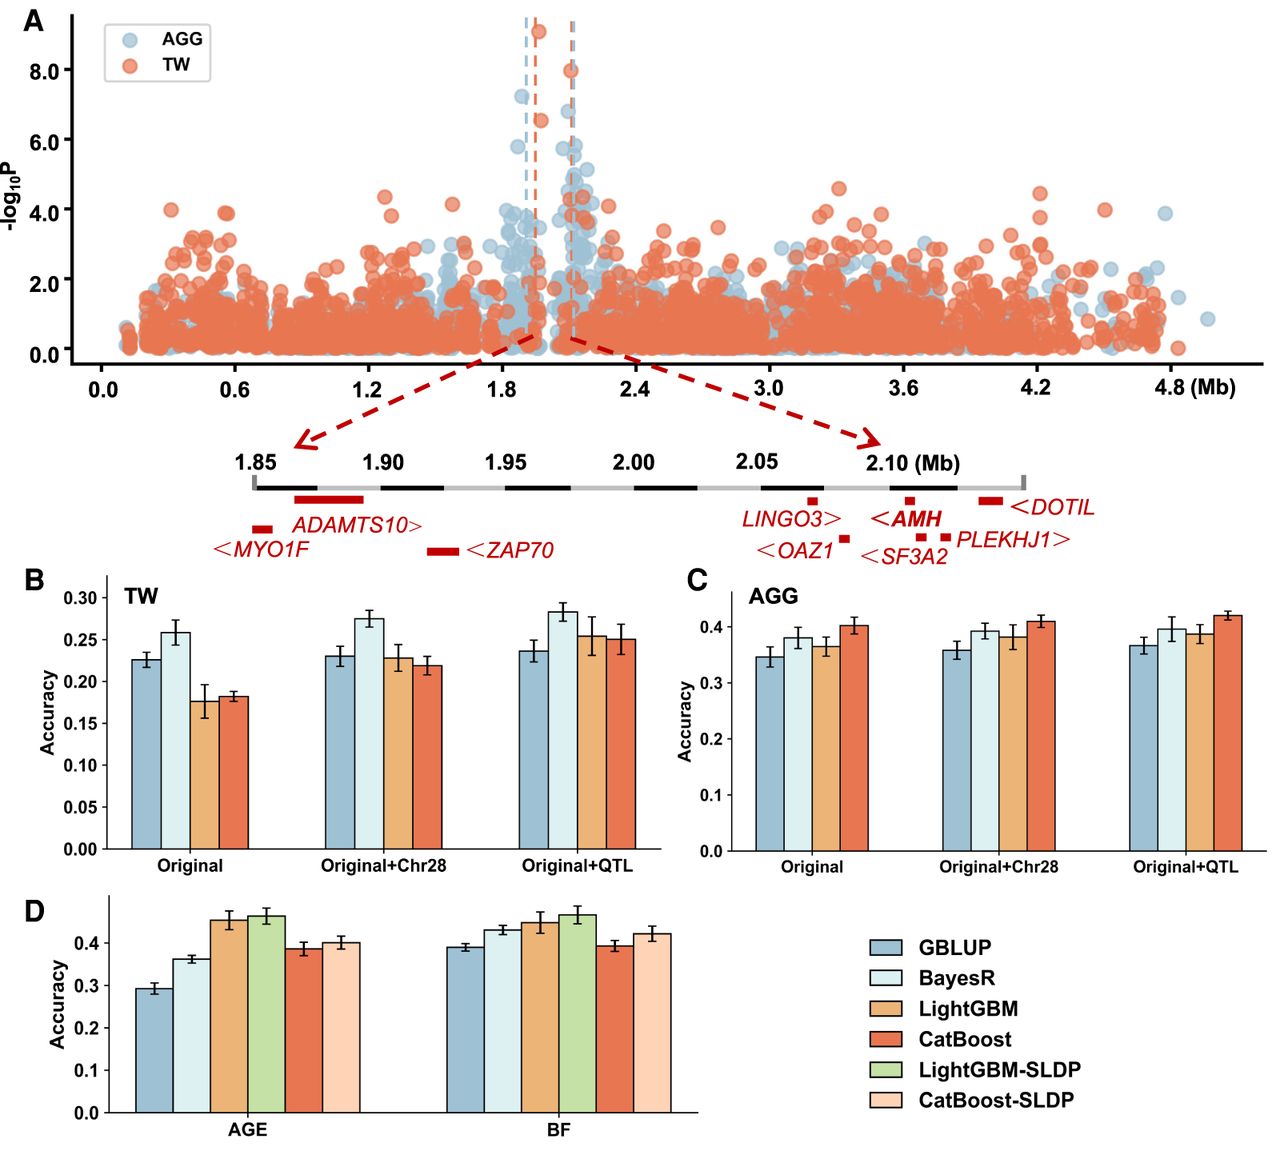
The refined improvement of features impacts the prediction accuracy. (A) Manhattan plot of Chromosome 28 for AGG and TW traits. The x-axis represents the genomic position (Mb) along Chromosome 28, and y-axis denotes the −log10 P-value from the GWAS. The blue and orange points represent SNPs associated with AGG and TW, respectively. The dashed curve marks the boundaries of the significant QTL loci for both traits within this genomic interval, which encompasses multiple candidate genes, including the AMH gene. (B,C) Comparison of prediction accuracy across different models for TW and AGG traits. The column chart shows the mean prediction accuracy for the four models, and the error bars show the standard deviation of the accuracy estimates from fivefold cross-validation. (Original) Prediction using original SNP data from Supplemental Table S1, (Original+Chr28) enhancing SNP density across Chromosome 28 using sequencing data, and (Original+QTL) increasing marker density specifically within the identified QTL region on Chromosome 28. (D) Prediction accuracy of AGE and BF traits based on SLDP feature optimization strategy. The comparison includes the GBLUP, BayesR, LightGBM, and CatBoost models, as well as the two ML models combined with SLDP optimization (LightGBM-SLDP and CatBoost-SLDP).