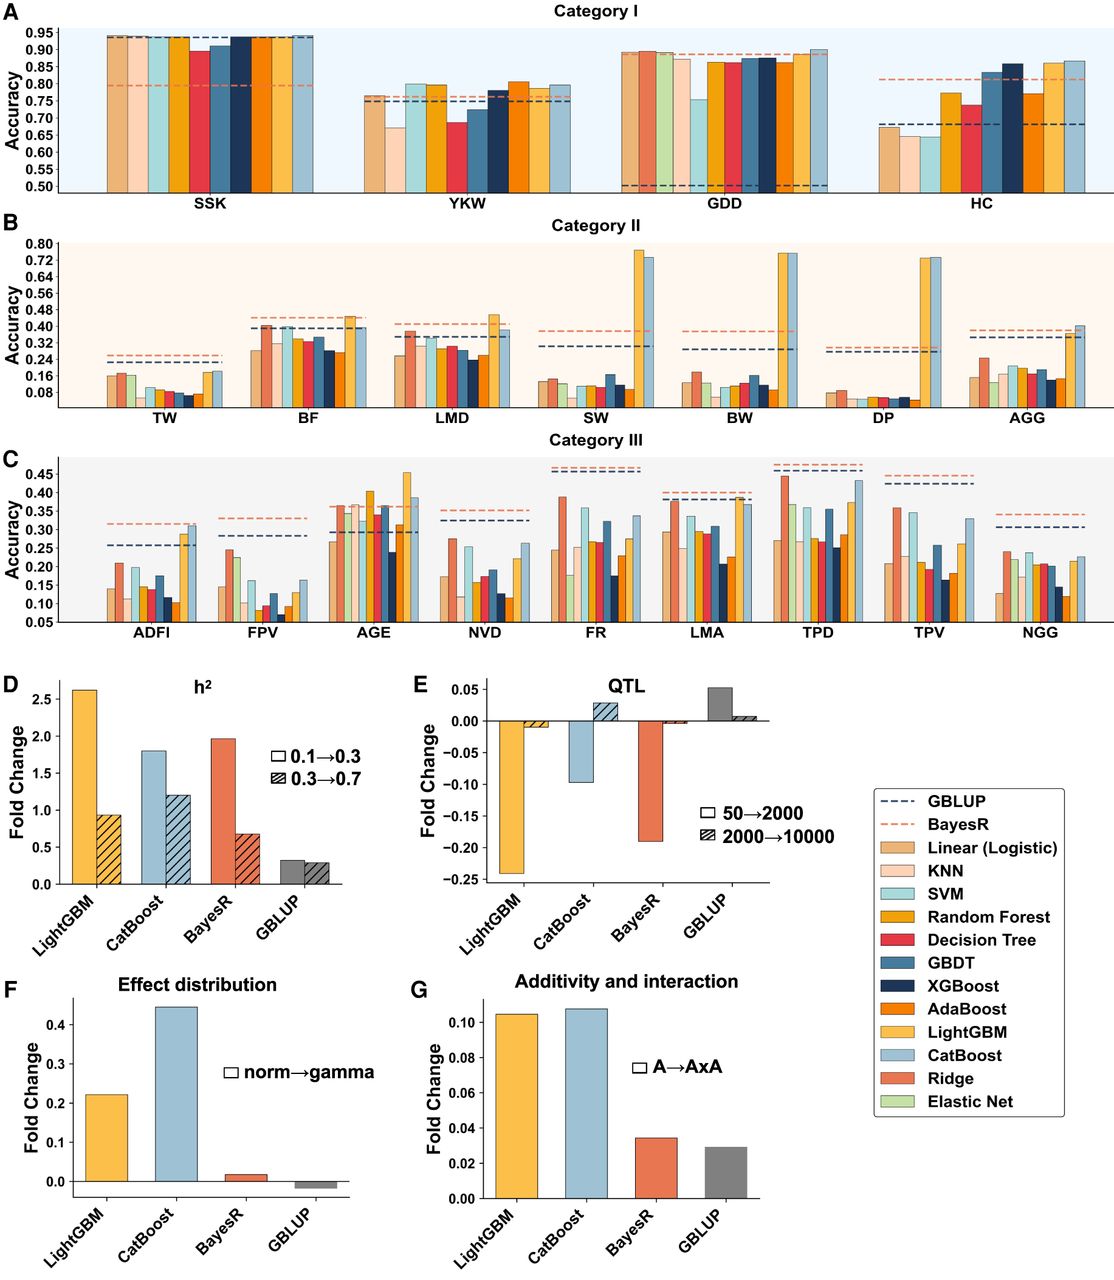
Prediction accuracy comparison using real and simulated data. (A–C) Real data categorized into three classes, employing GBLUP (dark blue dashed line) and BayesR (orange dashed line) as baselines for comparison with 12 machine learning (ML) methods. Some methods are unavailable for a minority of traits. The vertical axis represents results from fivefold cross-validation. (D–G) Simulated data used to evaluate how heritability (D; 0.1, 0.3, 0.7), the number of known QTLs (E; 50, 2000, 100,000), distribution of genetic effects (F; normal, gamma), and genetic models (G; additive, additive × additive) influence the accuracy of four models. The vertical coordinate represents the fold change in prediction accuracy before and after the variation of each single variable.