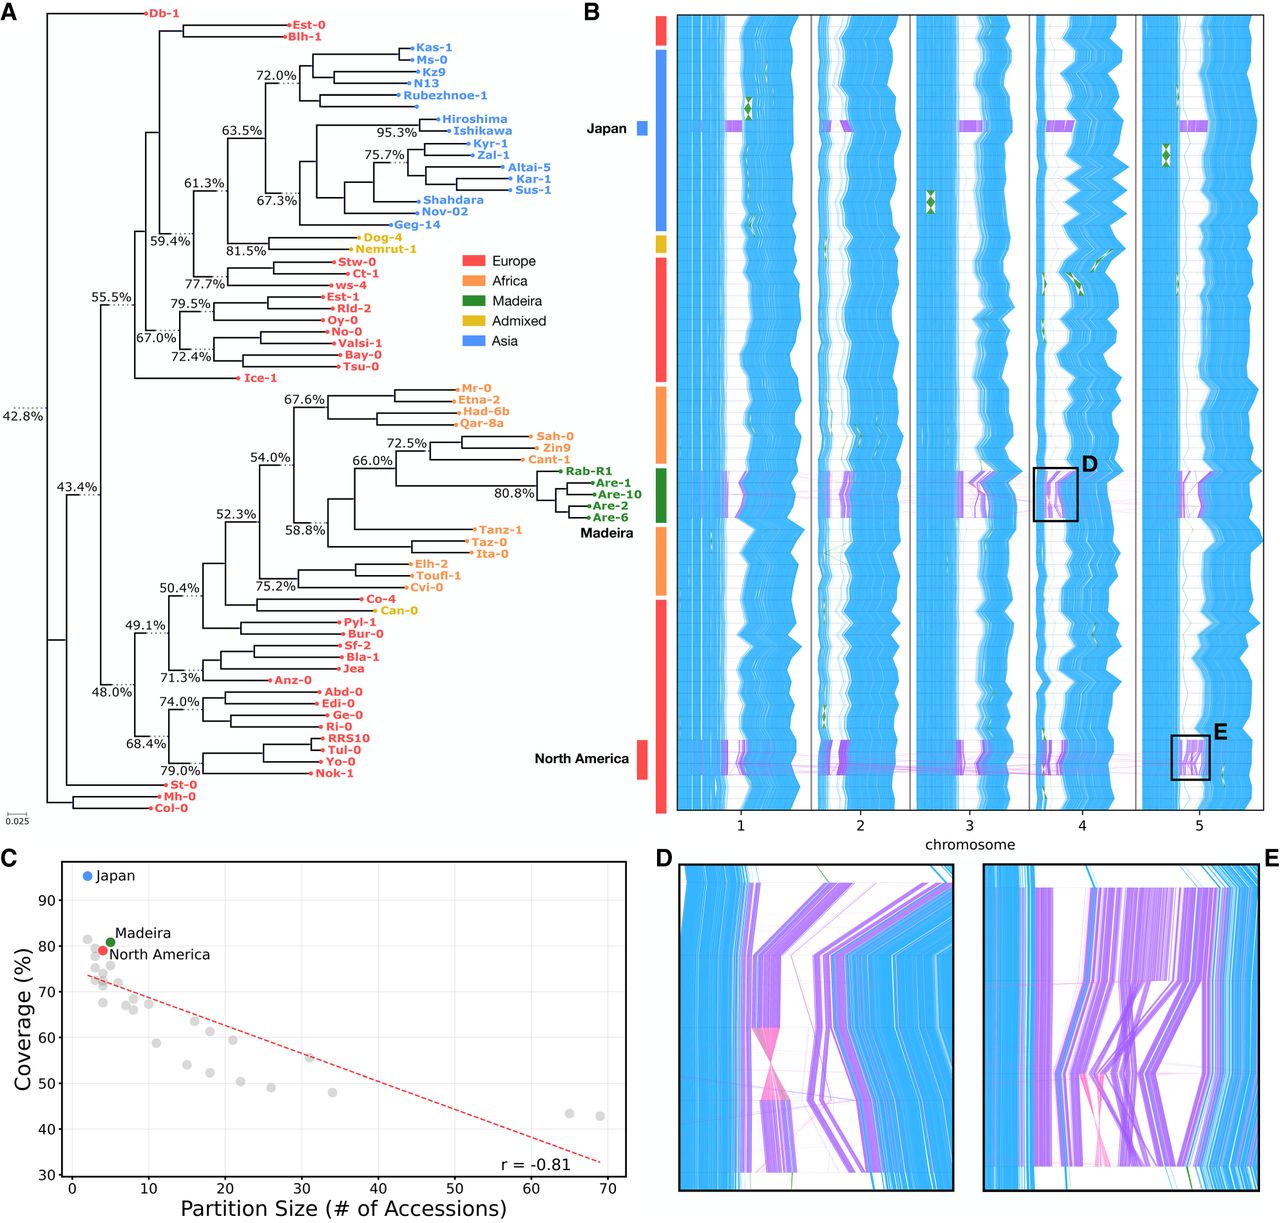
Applying MumemtoM to the A. thaliana pangenome reveals geographic region–specific variation. (A) Phylogeny of geographically diverse A. thaliana accessions (Lian et al. 2024), with broad geographical regions colored. Internal nodes are labeled with the coverage of partial multi-MUMs across the leaves of each node. Internal node partial MUMs are computed by merging subtree-based partitions progressively up the phylogeny. (B) Global multi-MUM synteny across the full data set shown in blue (with inversions in green). Global MUMs are computed by merging all partitions together (representing the root node). Additionally, three geographically distinct subgroups are highlighted and partition-specific multi-MUMs (in purple, with inversions in pink) reveal local structural variation in centromeric regions. Two examples are shown in zoomed-in panels: (D) a novel inversion located in accessions from the Madeira islands, and (E) a complex inversion/rearrangement in the North American subgroup Chr 5 centromere. (C) Coverage of internal nodes in the phylogeny compared to the number of leaves under node. Three highlighted subgroups show particularly high coverage, likely due to geographical isolation (Lian et al. 2024).