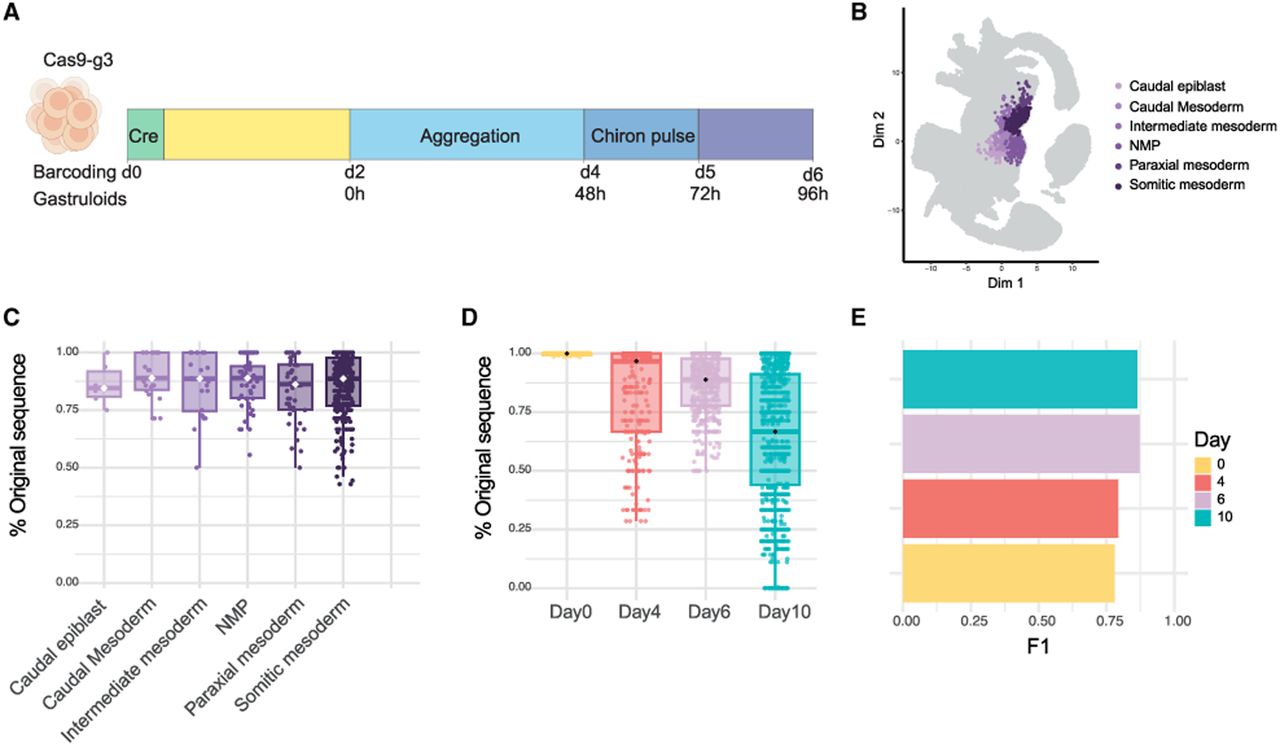
Barcoding rate in gastruloids and temporal prediction. (A) Schematic of the experimental design for gastruloid formation and barcoding. Cre induction was performed on day 0 (d0). After 2 days (yellow bar), cells were plated for aggregation (light blue). On day 4 (d4), a Chiron pulse (CHIR99021) was applied to promote gastruloid elongation and cell differentiation (dark blue). Gastruloids were further cultured (purple bar) and collected on day 6 (d6) of barcoding (96 h of gastruloid culture) for single-cell sequencing (18 gastruloids). (B) UMAP projection of a reference atlas of mouse embryos (E6.5 and E8.5). Nearest neighbor analysis was used to assign cell-type labels to the gastruloid cells based on their proximity to the cells in the reference atlas. Gastruloid cells are overlaid in purple, colored by lineage. (C) Box plot showing the percentage of the original barcode sequence per cell type in day-6 gastruloids. (D) Box plot showing the distribution of the proportion of original barcode sequences across different time points (days 0, 4, 6, and 10) in single cells. Each point represents one cell. (E) Bar plot showing the F1 score for each time point (days 0, 4, 6, and 10) obtained from the random forest model on the test data. Bars are colored according to the corresponding day. For all box plots, the boxes represent the IQR with the horizontal line inside each box indicating the median.