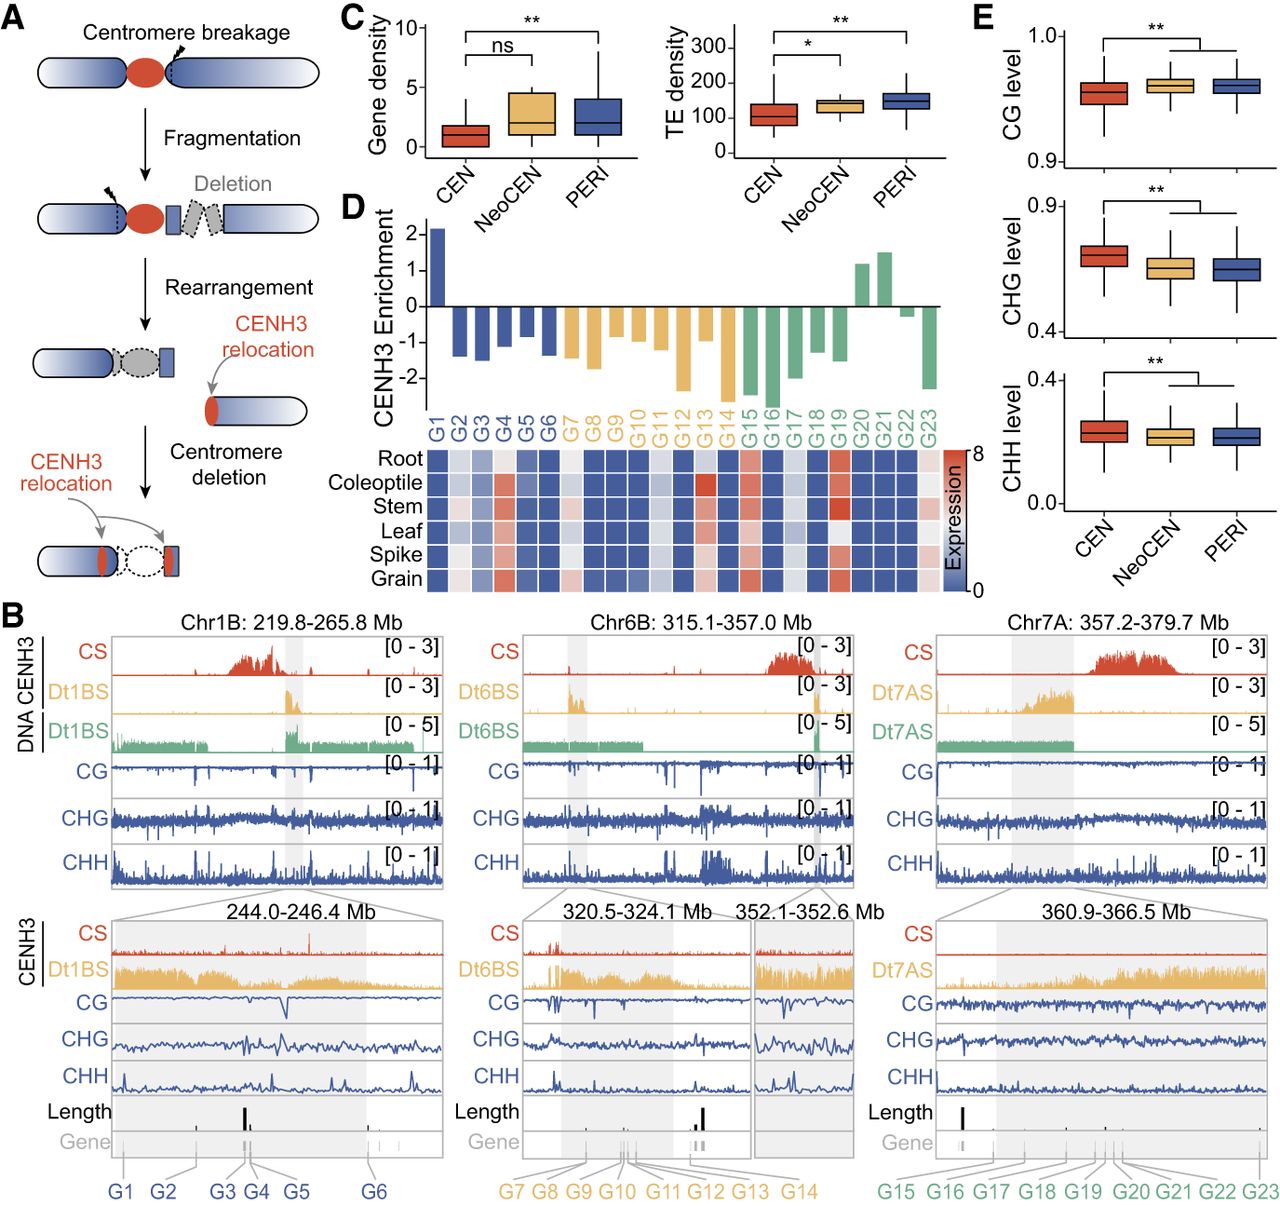
De novo centromere formation in acentric chromosome fragments following centromere deletion and complex structural rearrangements in wheat. (A) Schematic model depicting centromere misdivision leading to chromosome breakage and the formation of a neocentromere in wheat. Breakage (indicated by arrowhead) occurs near one side of the original centromere, resulting in an acentric chromosome fragment. Subsequent local fragmentation and rearrangement lead to the deletion of the native centromere. A new CENH3-enriched domain is established at a novel chromosomal location, often adjacent to the former centromeric region, indicating neocentromere seeding. (B) CENH3 ChIP-seq signal profiles in the centromeric regions of Dt1BS (left), Dt6BS (middle), and Dt7AS (right), compared to their corresponding regions in CS wheat. Neocentromeres and their syntenic positions in CS are highlighted in gray. IGV snapshot showing DNA methylation levels (CG, CHG, and CHH contexts), gene annotations, and genomic coordinates are shown below. CENH3 relocation indicates centromere repositioning relative to CS. (C) Quantitative comparison of gene and transposable element (TE) density across three genomic regions: the original centromere (CEN), the neocentromere (NeoCEN), and the flanking pericentromeric regions (PERI), calculated in 10-Mb windows. TE density is elevated in NeoCEN relative to surrounding regions, whereas gene density shows moderate variation. (D) Gene expression levels and corresponding CENH3 enrichment are shown for 23 annotated genes (G1 to G23) located within and around the neocentromeric region. Expression values across six wheat tissues (root, coleoptile, stem, leaf, spike, and grain) are provided. CENH3 enrichment is plotted separately, indicating localized centromeric chromatin reestablishment over a subset of these genes. (E) Whole-genome bisulfite sequencing (WGBS) analysis reveals DNA methylation levels (CG, CHG, CHH contexts) in CS wheat across the CEN, NeoCEN, and PERI regions. NeoCEN and PERI regions in CS background show different methylation profiles relative to native centromeres. Statistical significance using Student's t-test: (*) P < 0.05, (**) P < 0.01, (ns) not significant.