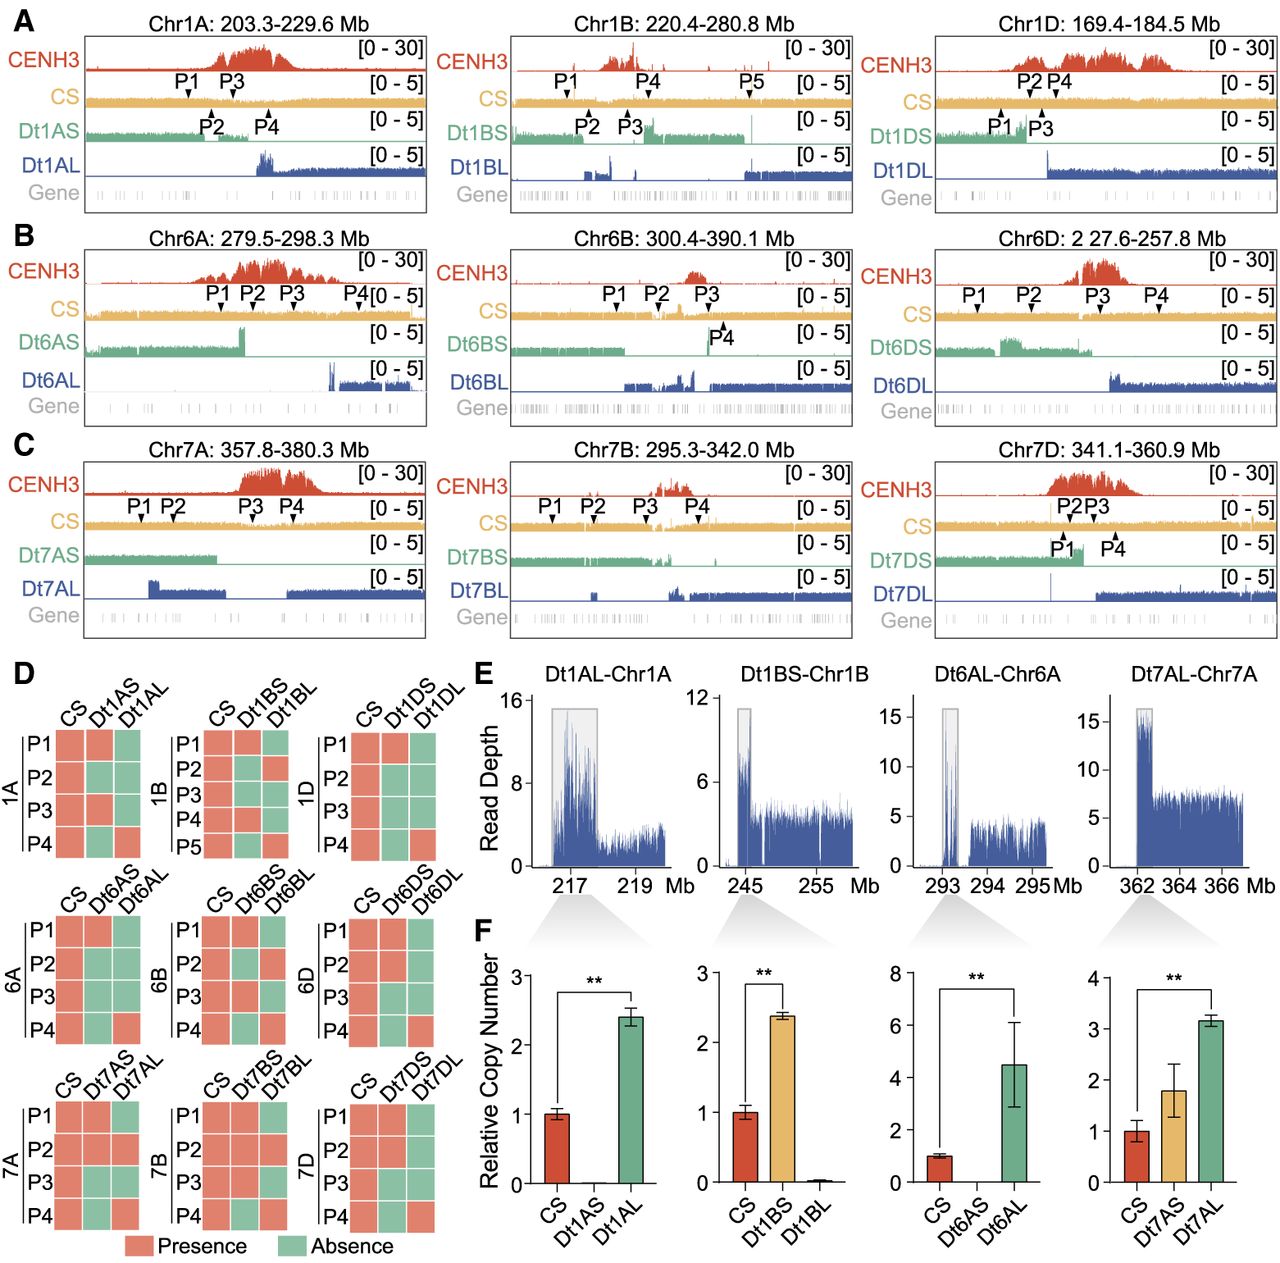
Localized complex chromosomal structural variations at damaged centromeres in wheat ditelosomic lines. (A–C) Genomic-wide resequencing read depth analysis around centromere breakpoints in ditelosomic chromosomes from wheat homoeologous groups 1 (A), 6 (B), and 7 (C). Each subpanel displays multiple tracks: the top track marks the centromeric regions based on CENH3 ChIP-seq signals. The next four tracks show normalized resequencing coverage (reads per genomic content, RPGC) in 10-bp bins for Chinese Spring wheat and both short-arm (S) and long-arm (L) telosomes of ditelosomic lines. The bottom track presents annotated gene distributions. Triangles in the CS tracks denote primer positions used for PCR validation of genomic regions near breakpoints. (D) Agarose gel electrophoresis results showing the presence (red) or deletion (green) of specific terminal chromosomal fragments in various ditelosomic lines. PCR amplifications were conducted using primers targeting regions flanking the breakpoints in Chromosome 1, 6, and 7. (E) Copy number variations (CNVs) in genomic regions adjacent to breakpoints, based on read depth analysis. Four specific intervals are shown: Dt1AL (Chr 1A: 216,799,654–217,769,250), Dt1BS (Chr 1B: 243,980,001–245,644,800), Dt6AL (Chr 6A: 293,023,801–293,313,400), and Dt7AL (Chr 7A: 362,003,351–362,687,599). Each line shows altered read depth, reflecting structural rearrangements and CNVs. (F) Quantitative PCR (qPCR) analysis validating the CNVs observed in panel E. Relative copy number values for targeted genomic fragments are shown for ditelosomic lines and compared against CS wheat. Statistical significance was assessed using Student's t-tests; (**) P ≤ 0.01.