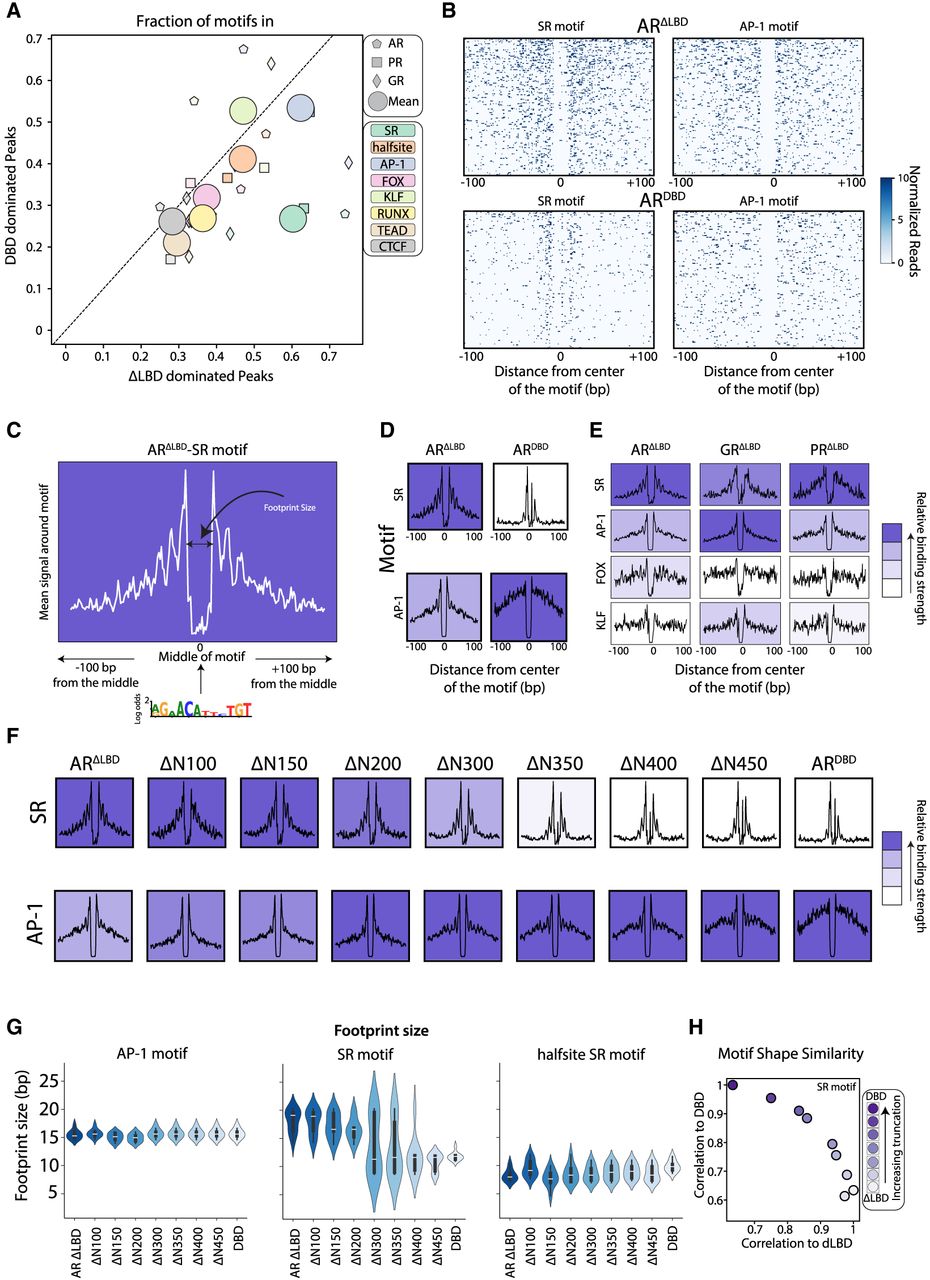
Footprint analysis defines SR binding at canonical and noncanonical motifs. (A) Enrichment of noncanonical motif remains largely invariant to NTD deletion. Shown are the fractions of motifs in SRΔLBD-dominated (x-axis) and SRDBD-dominated (y-axis) peaks (as defined in Fig. 4) for the eight analyzed motifs and three SRs, as indicated. The circles indicate the mean over the three SRs. (B–D) Visualizing the SR and AP-1 footprint. (B) The locations of cleavage sites (read ends) of the indicated factors at sequences surrounding the indicated motifs (Methods). For this analysis, the top 10% bound motifs within binding peaks were selected, ordered by the binding signal, and are shown as rows in this matrix, together with the ±100 bp surrounding regions (Methods). (C,D) The annotated example of the average profile for the ARΔLBD on the SR motif (C); respectively, mean profiles for the indicated AR mutants and motifs (D). The background is colored by the mean signal at the motif and normalized intrafactor (column-wise). Note the virtually absence of reads at the motif itself, and the accumulation of reads at the immediate flanking regions. (E–H) Truncation of NTD and the motif signatures of SRs. (E) The average profiles of LBD-deleted mutants over the indicated motifs. (F) The average profiles of the AR truncations on the SR and AP-1, background color as in D. (G) The estimated sizes of the cleavage-protected region (footprint size; Methods) for the AR variants for AP-1, SR, and half-site motifs. (H) Correlation of SR motif signal to DBD reference motif (y-axis) versus ΔLBD reference motif (x-axis) for each truncation variant. Color gradient indicates progressive truncation from ΔLBD (white) to maximally truncated DBD-only (dark purple) as indicated in the legend.