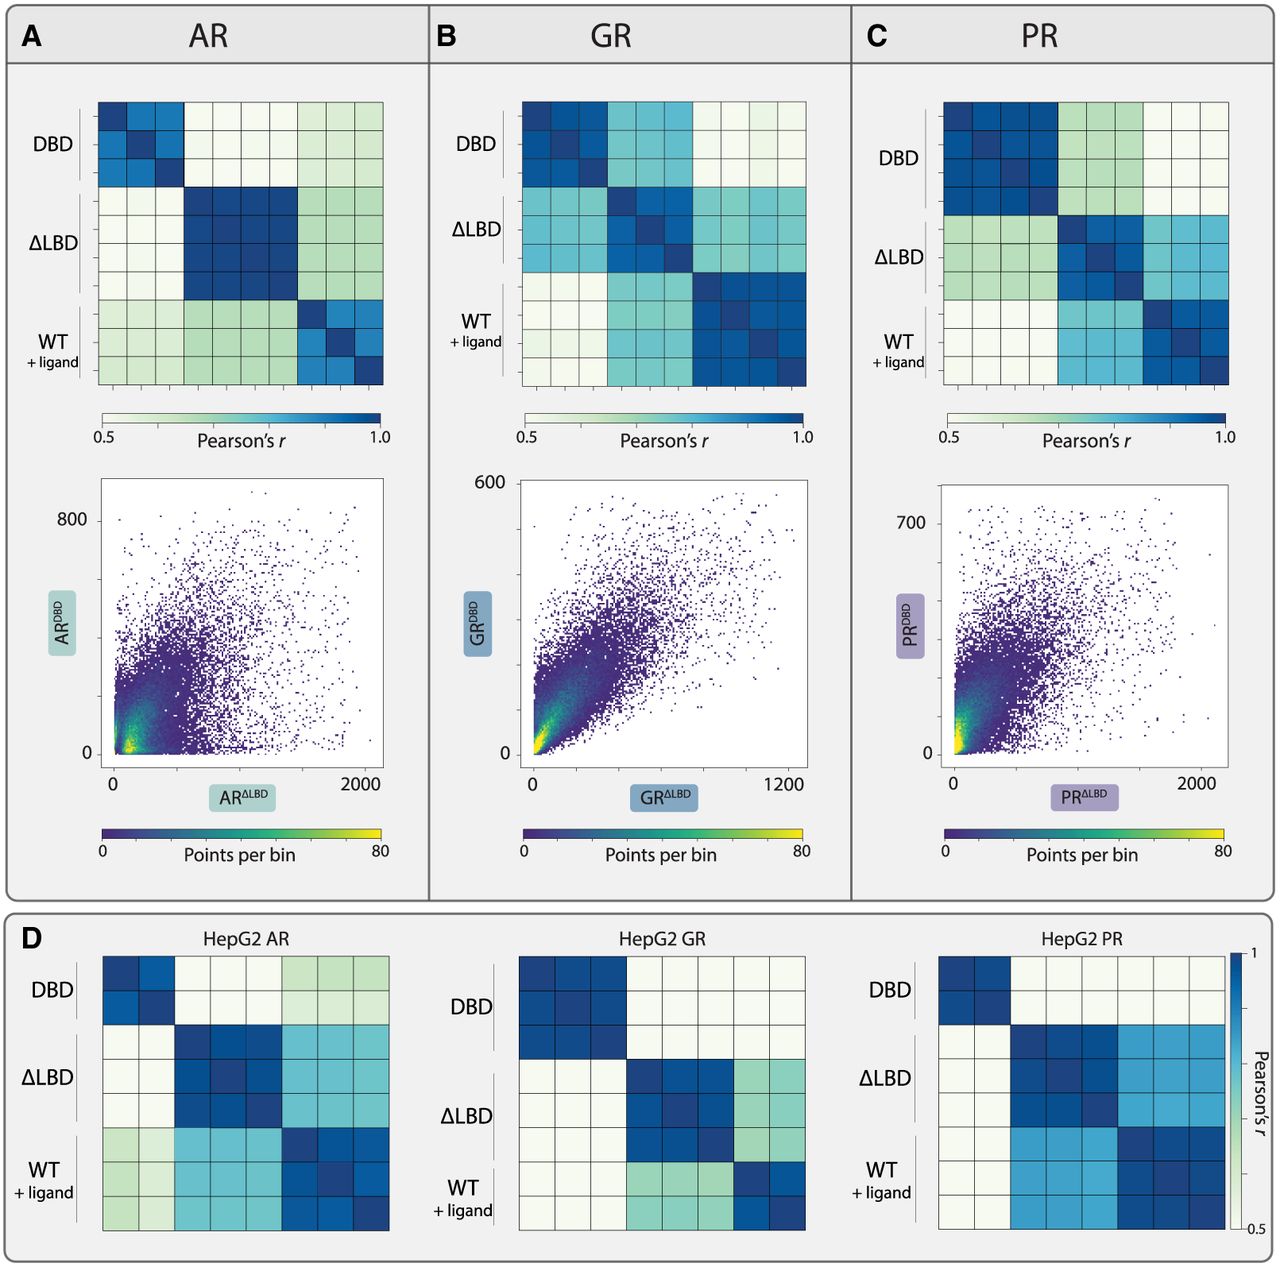
Figure 3.
Both the NTD and the LBD contribute to the selection of SR binding targets. (A–C) NTD deletion shifts the binding preferences of SRs. Shown are the correlations in peak binding between each SR and its LBD-deleted and DBD mutants, with all repeats included (top). Binding at individual peaks is also compared as scatter plots (bottom; sum of signal on the peak, and the color indicates density). (D) The NTD directs SR binding in the HepG2 cell line. We profiled binding locations of the three SRs and the indicated mutants in the HepG2 cell line. The correlations in peak binding between the full-length SRs and the indicated mutants are shown.