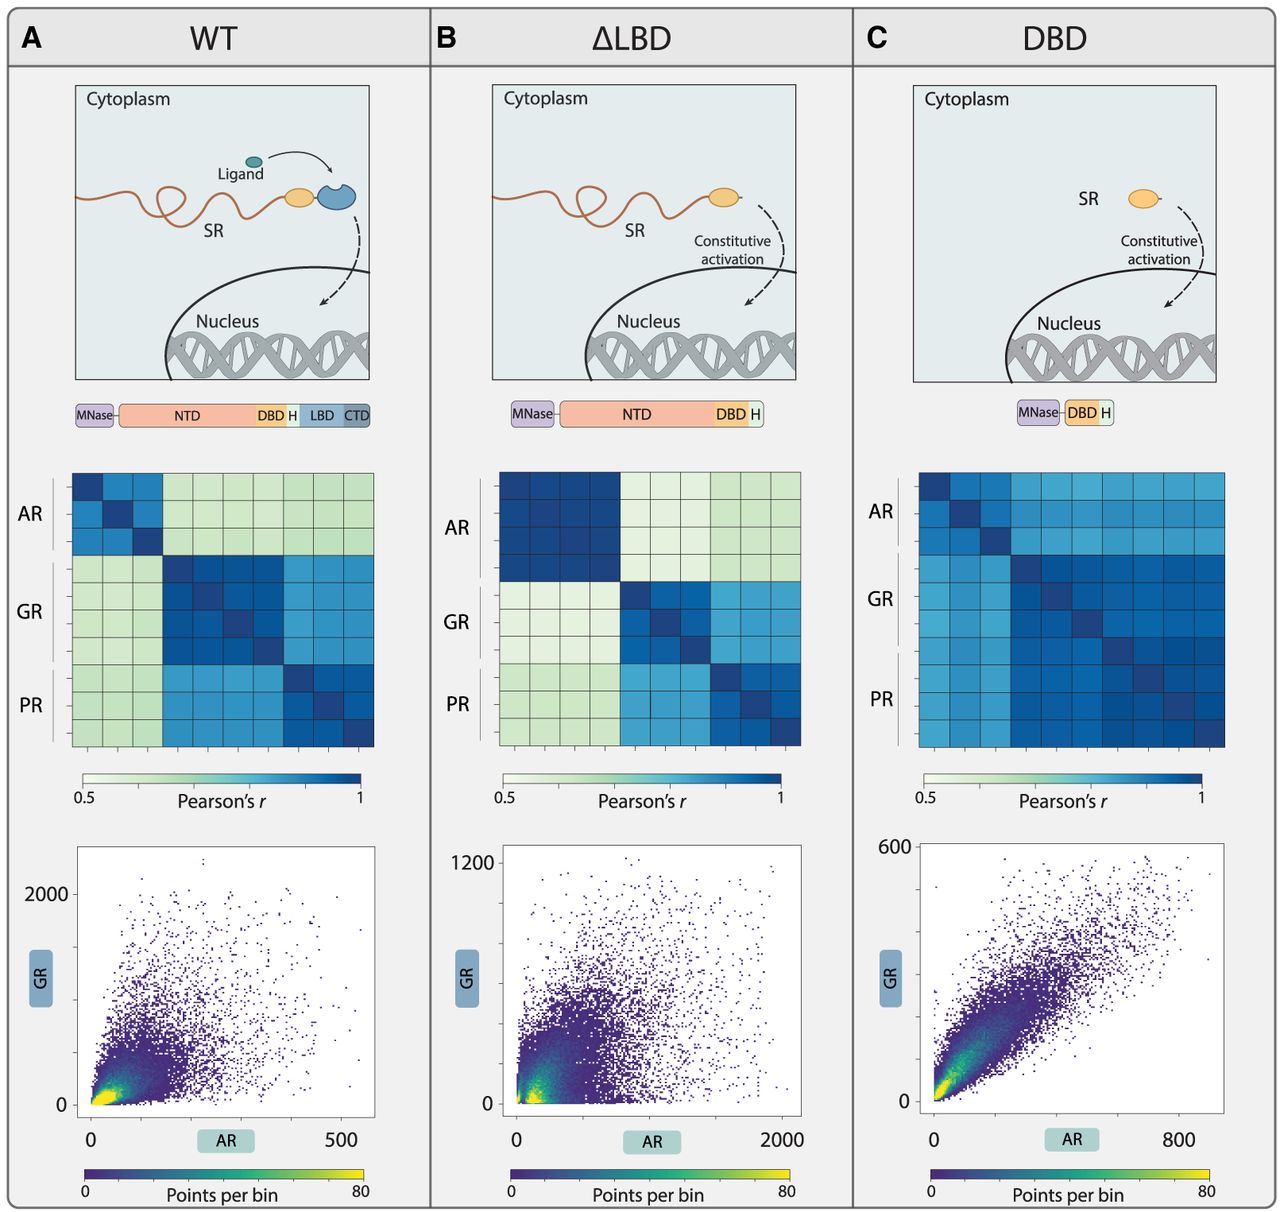
Differences in SR binding profiles are not explained by LBD or DBD preferences. (A) AR binding peaks differ from those of GR and PR. Binding profiles of the hormone-stimulated SRs were compared (top; scheme, illustrated beneath are the full-length MNase-fused SRs). Shown is the correlation of binding signals across the set of peaks bound by at least one of the compared factors (about 30,000 peaks), with all repeats included (beneath; Methods). Binding at individual peaks is also compared as scatter plots (bottom; sum of signal on peak; 99.8% of data is shown to remove the outliers, and the color indicates density). (B) Binding locations of LBD-deleted AR are distinct from those of GR and PR. Hormone-independent activation of SRs was achieved by deletion of their ligand-binding domains (LBDs). Binding profiles were measured in the absence of hormones (top; scheme, illustrated beneath are the LBD-deleted mutants). The figure compares the binding profiles of the three LBD-deleted mutants, as in A. (C) The three DBDs bind the same genomic sites. DBD mutants were generated by deleting both the LBD and the NTD. Binding profiles were measured in the absence of hormones (scheme, illustrated beneath are the DBD mutants). The figure compares the binding profiles of the three DBD mutants, as in A.