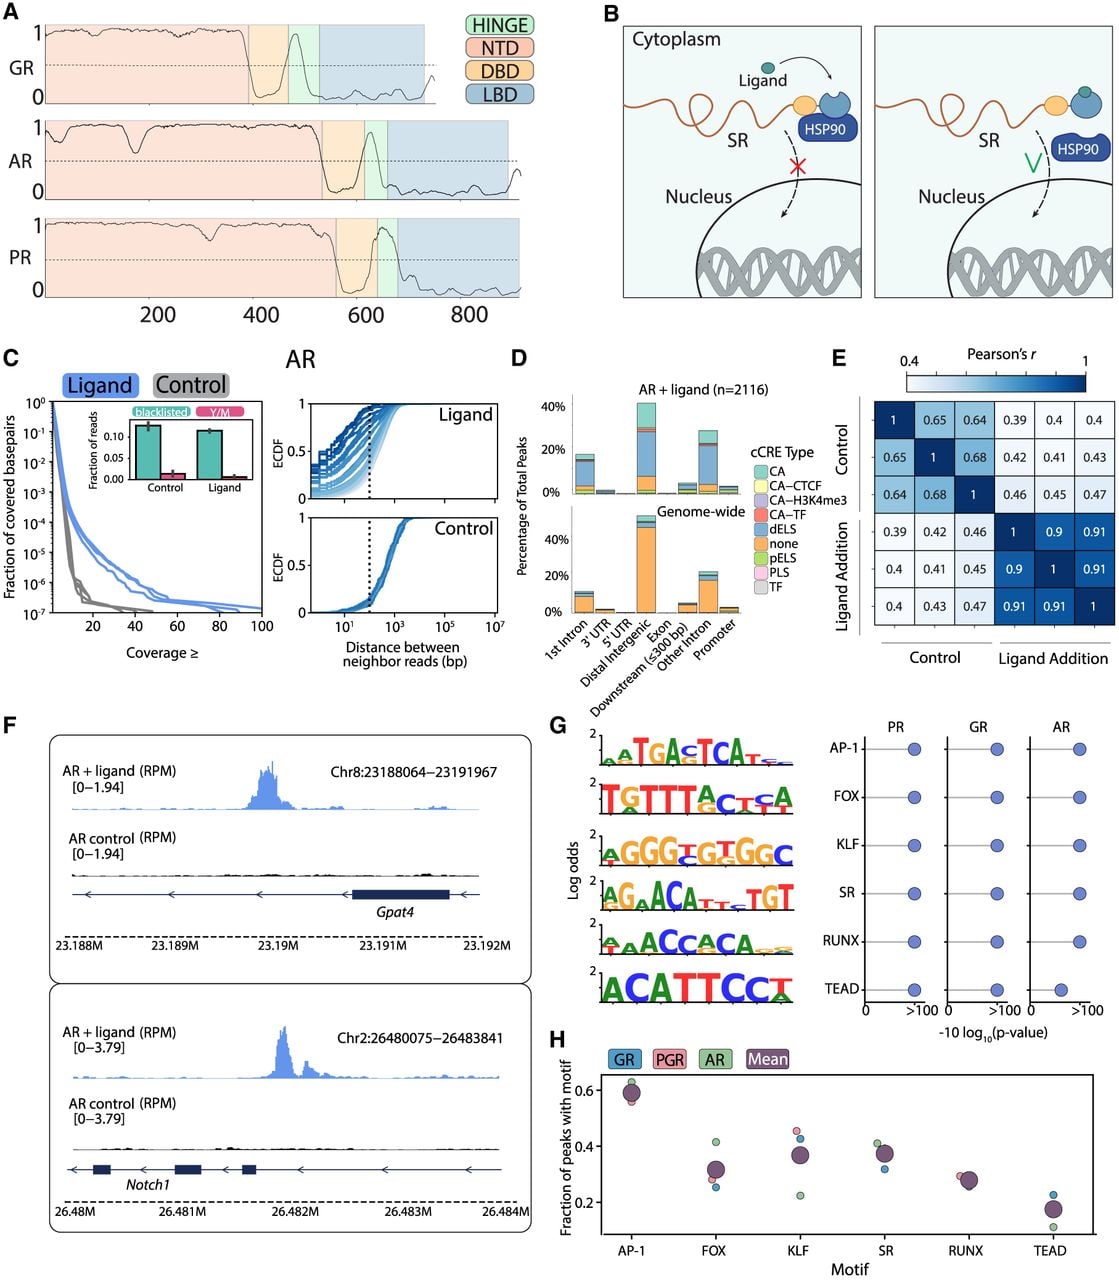
Using ChEC-seq for mapping transcription factor (TF) binding locations across mammalian genomes. (A) The domain architecture of the three selected SRs. The predicted protein-sequence disorder tendencies of GR, AR, and PR are shown using Metapredict V2 (Emenecker et al. 2021). The four domains characterizing the NR TFs are color-coded, as indicated. (B) Scheme of how hormone binding releases SR from cytoplasmic retention. The binding of hormones to the ligand-binding domain (LBD) releases the SRs from cytoplasmic retention by the HSP90 chaperone, triggering their nuclear translocation, when they bind and regulate their target genes. (C) ChEC-seq profiles of activated SRs are distinguished by the distribution of cleaved sites. Shown are the distributions of per-nucleotide reads coverage for hormone-stimulated and nonstimulated AR (left; blue and gray lines, with three repeats each; Methods) and the distribution of distances between cleavage sites (right; with cleavage events grouped by read coverage indicated by color intensity; Methods). Note that cleavage sites are sparsely distributed in the control sample but tend to accumulate at the same or adjacent reads in the stimulated ones. The fraction of reads that map to the blacklisted regions and the Y or mitochondrial chromosomes is shown in the insets. For similar data for GR, PR, and SMAD1, see Supplemental Figure S1C. (D) SR binding peaks preferentially overlap regulatory sites. Shown on the left is the fraction of AR binding peaks localized across genomic features and cis-regulatory elements (CRE), compared with their genomic distributions. Here, SCREEN (The ENCODE Project Consortium et al. 2020) annotations were used for distal or enhancers, proximal enhancers, or regions lacking annotations (“dELS,” “pELS,” and “none”). (E) Binding profiles of SRs are reproducible. Correlation in peak binding across repeats of hormone-stimulated and nonstimulated controls (Methods). (F) Genomic tracks of AR binding. Shown are Gpat4 and Notch1, selected as strong targets of AR. Note the strong binding signal specifically of the hormone-stimulated AR. (G) Motif enrichment within SR peaks. Shown are the top enriched motifs within the three SR-bound peaks, as found by de novo motif finders, together with the respective P-values (Methods). (H) The fraction of peaks containing each motif. Shown for the individual SRs (small dots) or the average of the three (purple dot).