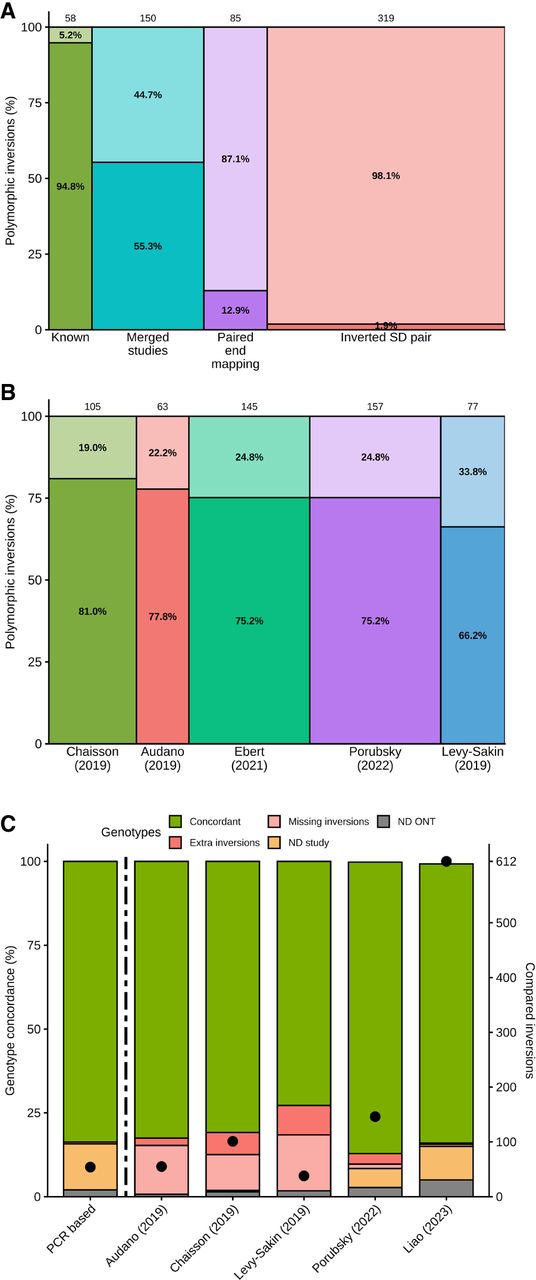
Comparative analysis of inversions identified in this and previous studies. (A) Mosaic plot representing the proportion of the 612 analyzed regions derived from different sources (bar width, with the number of regions indicated in the top part) and those that were detected in ONT data as polymorphic inversions (dark color) or not (light color). (B) Mosaic plot representing the candidate regions from each of the merged SV studies included in our analysis (bar width with the total number indicated in the top part) and the percentage detected as polymorphic inversions (dark color) or not (light color). (C) Concordance of ONT genotypes with PCR-based experimental data (separated by dashed line) and five other studies analyzing the same samples and inversion regions (left y-axis). Genotypes are classified as concordant, as having extra or missing inverted alleles, or as not determined (ND) in ONT data or the other study used for comparison. Black dots represent the number of inversions compared in each data set (right y-axis).