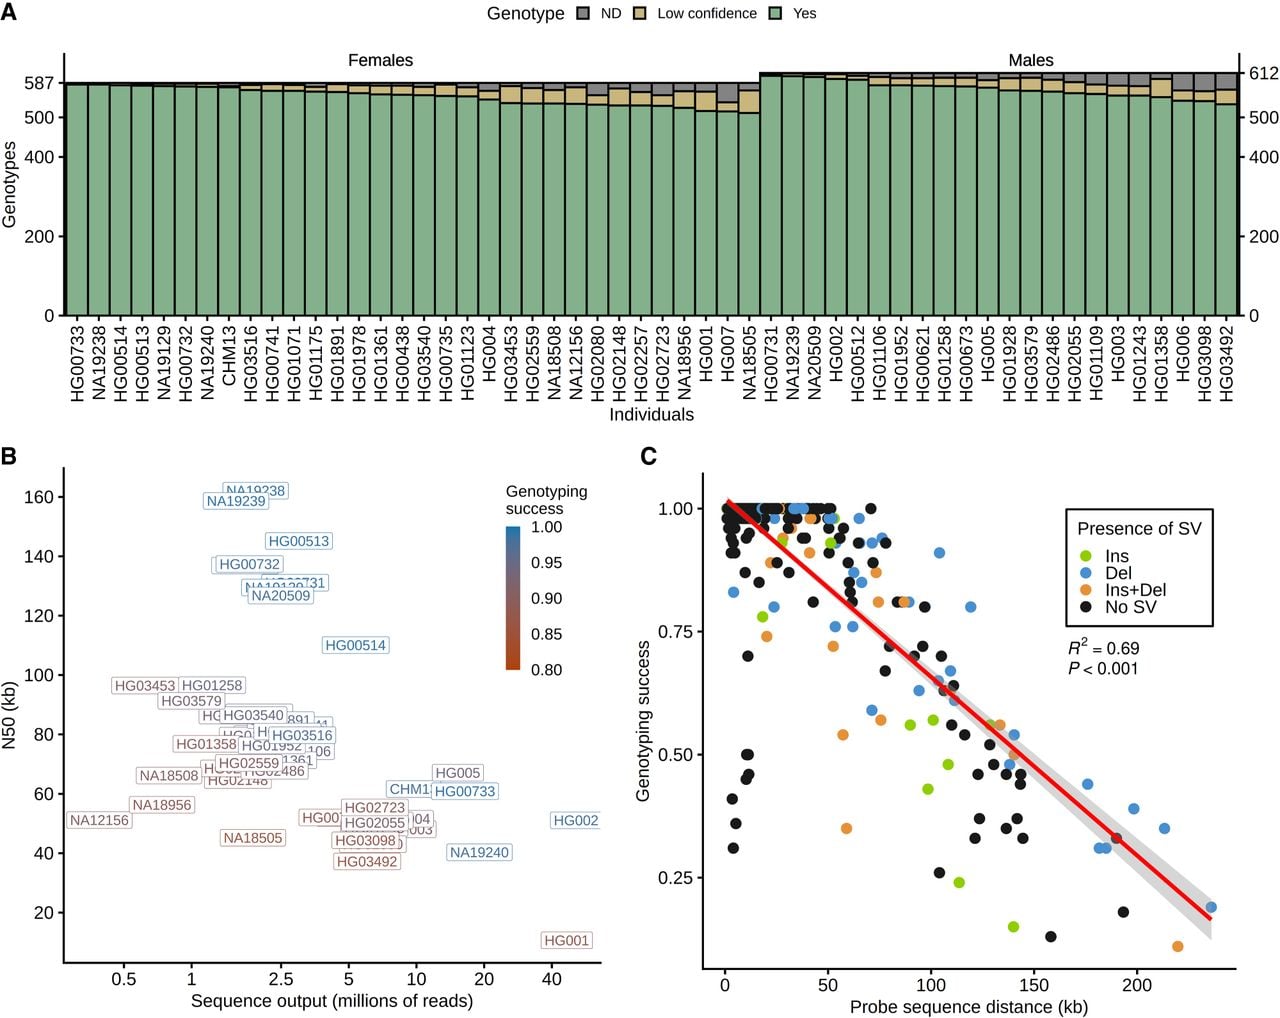
Genotyping success of candidate inversion regions from ONT data in 54 individuals. (A) Summary of inversion genotyping results by individual (612 for males and 587 for females, excluding 25 inversions located in Chr Y), with resolved genotypes in green, low-confident genotypes owing to a reduced number of reads in yellow, and those with no supporting reads (not determined [ND]) in gray. (B) N50 values and total number of reads for each sample, showing the genotyping success rate on a red to blue scale. (C) Genotyping success of candidate inversion regions as a function of the average distance between the probe sequences flanking the breakpoints. Additional SVs detected in the analyzed regions, some of which can affect genotyping success, are indicated in different colors.