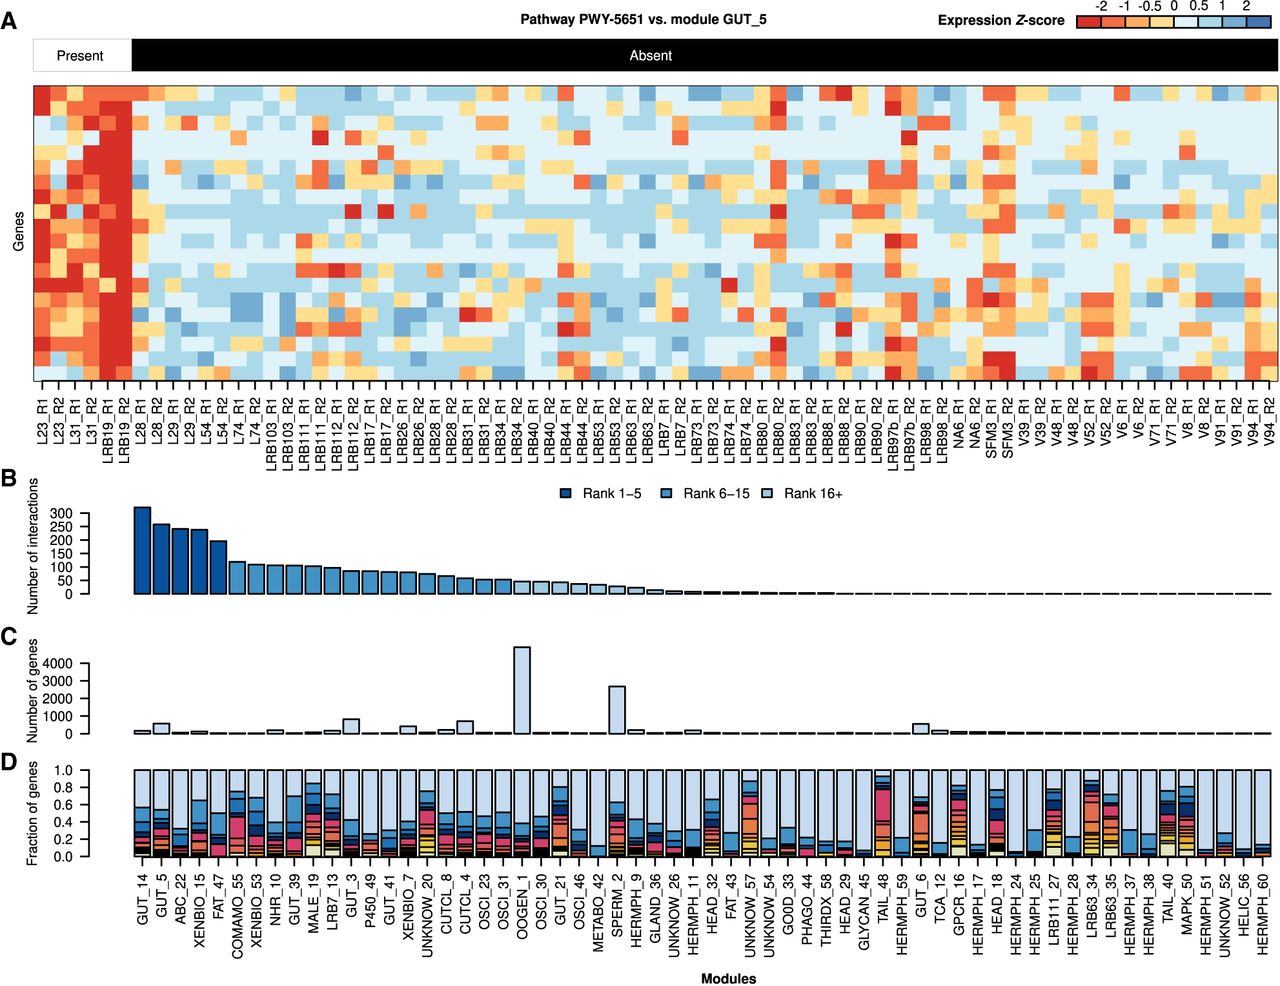
Interactions between bacterial pathways and coexpression modules. (A) The heat map shows a representative interaction between pathway PWY-5651 (L-tryptophan degradation to 2-amino-3carboxymuconate semialdehyde) and module GUT_5. Twenty randomly chosen genes from this module are shown together with their expression across different bacterial diets. These genes exhibit much higher expression on bacteria that have the PWY-5651 pathway. (B) The bars show the numbers of interactions per coexpression module. All of the top five and 11 out of the top 15 modules are associated with the intestine, detoxification, or specific metabolic pathways. The number of genes per module (C) and the phylostratigraphic distribution across modules (D) show that the five modules exhibiting the highest number of interactions are not the largest modules and are also not enriched in diplogastrid-specific orphan genes (phylostratum ≤ 9).