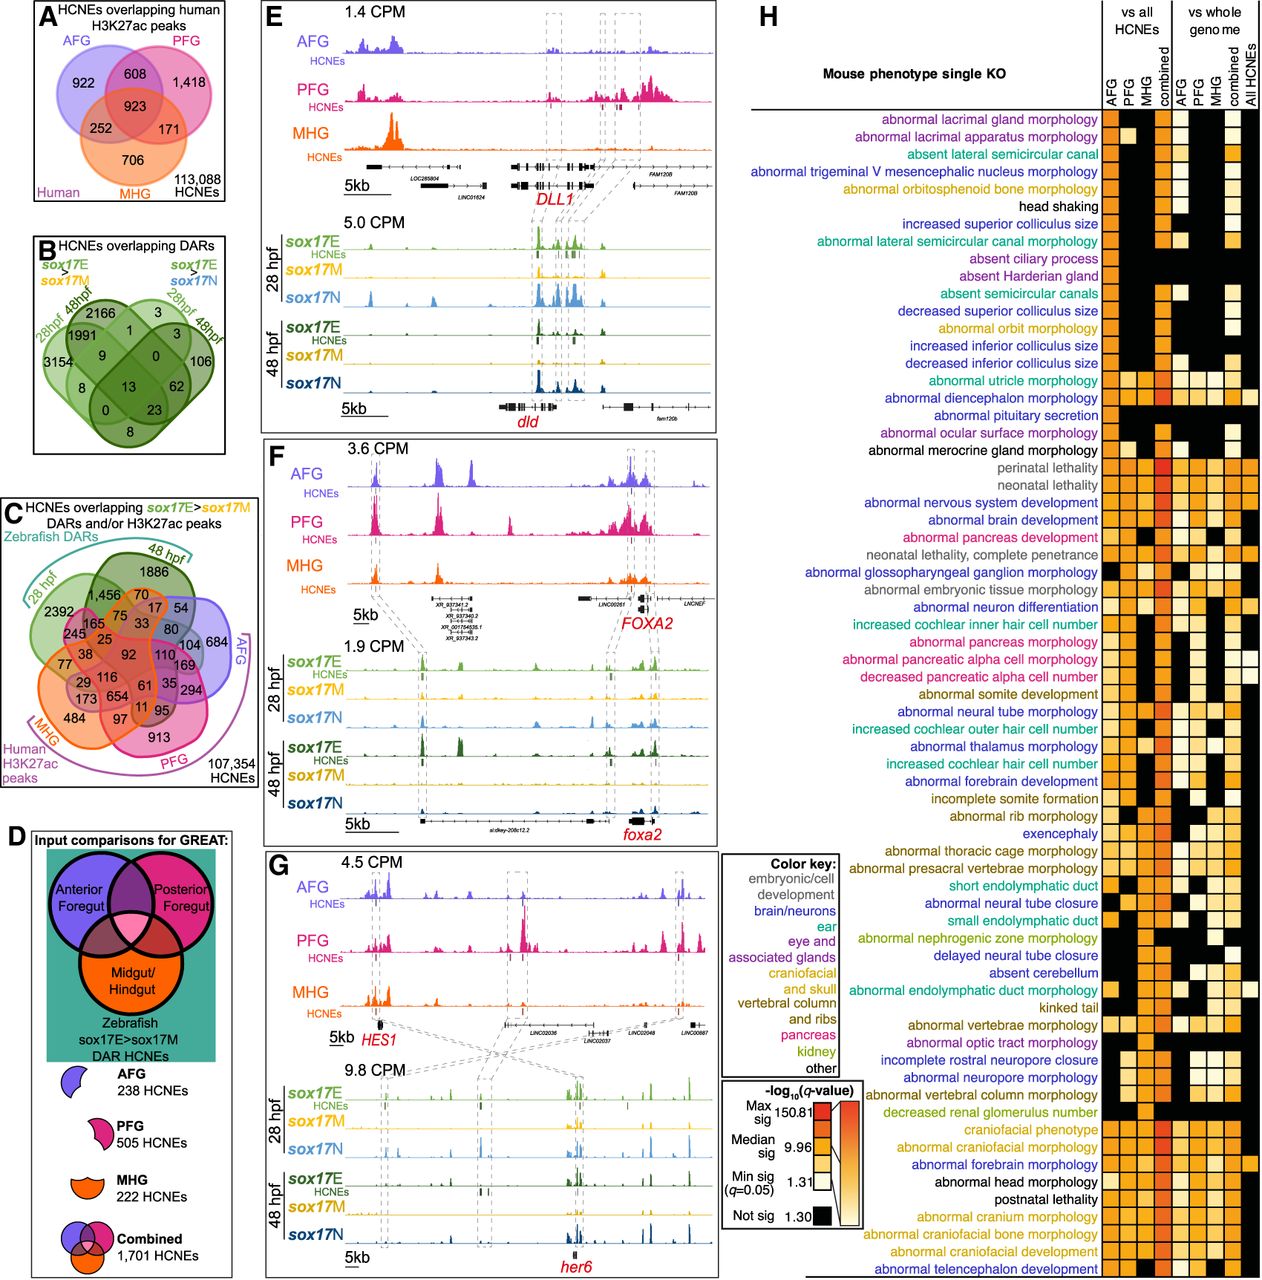
HCNE CRMs bearing the hallmarks of functionality in human and zebrafish endoderm are proximal to genes with deleterious pancreatic, neural, and craniofacial phenotypes. (A) Number of HCNEs overlapping human H3K27ac peaks in AFG, PFG, and/or MHG patterned endoderm cell populations derived from hESCs. Number of HCNEs not overlapping H3K27ac peaks are at the bottom right. (B) Distribution of HCNEs overlapping sox17E > sox17M DARs versus sox17E > sox17N DARs at 28 and 48 hpf. Number of HCNEs not overlapping DARs are at the bottom right. (C) Distribution of HCNEs overlapping sox17E > sox17M DARs also overlapping human H3K27ac peaks in AFG, PFG, and/or MHG patterned endoderm cell populations derived from hESCs. Number of HCNEs not overlapping H3K27ac peaks or DARs are at the bottom right. (D) Schematic of human HCNE subsets used for functional, anatomical, and phenotypic enrichment analyses using GREAT. (E–G) Example orthologous loci bearing zebrafish HCNE DARs and human H3K27ac HCNE peaks. Normalized peak heights in CPM are indicated. HCNEs overlapping peaks and DARs are displayed below and are color-coded as the tracks. Gray boxes and lines indicate regions with HCNE matches between species. (H) Heatmap of enrichment of single-gene mouse knockout phenotypes for collections of HCNEs as indicated in D. Significance in −log10(HyperFdrQ) is indicated both relative to the whole genome and to all HCNEs to account for nonrandom distribution of HCNEs. Discrete color-coded values in the key indicate minimum and maximum significance, with 25th, 50th, and 75th percentiles between, as indicated on the continuous scale. Terms are color-coded according to anatomical categories as indicated.