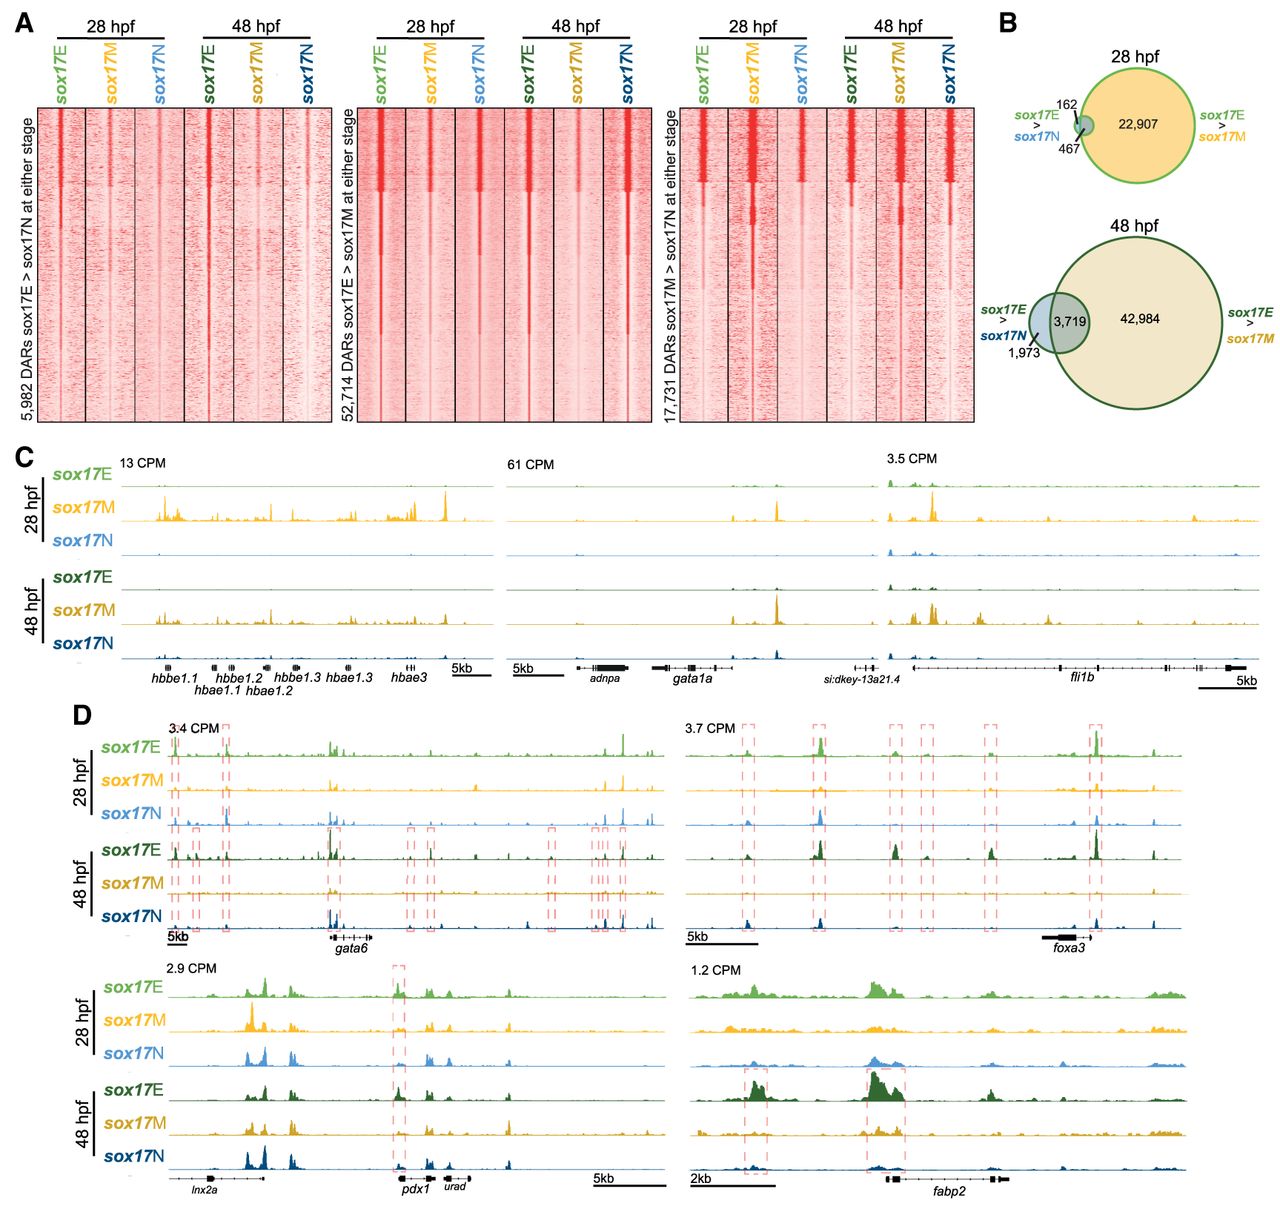
Sorted cell populations have distinct chromatin accessibility profiles indicative of constituent cell identities. (A) K-means clustered heatmaps of relative ATAC-seq read densities at differentially accessible regions (DARs; FDR ≤ 0.05) for the comparisons indicated. Clusters are rank-ordered from greatest to least accessibility in the sox17E population. (B) Venn diagrams indicating number of sox17E > sox17N DARs overlapping sox17E > sox17M DARs at 28 and 48 hpf. Venn diagrams indicating overlaps of called peaks used in the analysis are depicted in Supplemental Figure S6 and genomic distribution of DARs in Supplemental Figure S7. (C) Example loci indicating greater accessibility of erythrocyte marker genes (gata1 and hemoglobin gene cluster) and the endothelial marker fli1b in the sox17M population. (D) Example loci indicating greater accessibility of markers of the posterior foregut (gata6 and foxa3), pancreas and duodenum (pdx1), and liver and intestine (fabp2) in the sox17E population compared with sox17M and sox17N. Peak heights in counts per million reads (CPM) are indicated. Significant DAR comparisons in panel D and outlined in red. For zoomed-out tracks rescaled per condition to the strongest local peak, confirming the enrichment shown here, see Supplemental Figure S8.