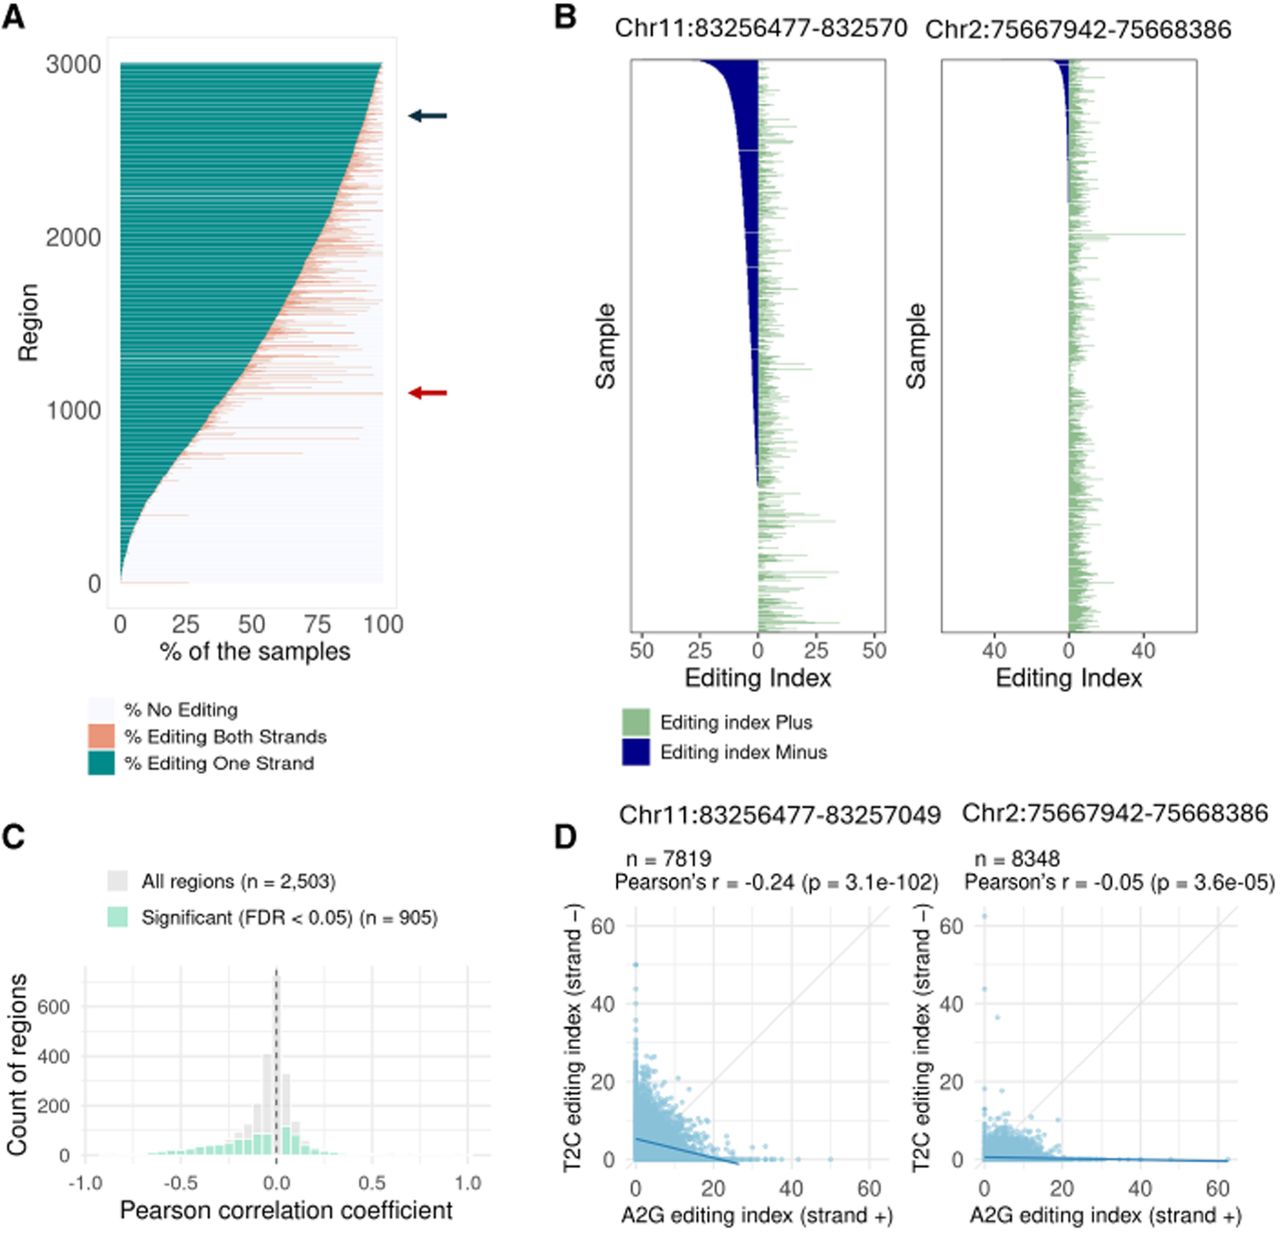
Concurrent editing of both strands. (A) Each candidate region was analyzed to determine the percentage of samples exhibiting editing (index > 0.5%) in both strands, only one strand, or no editing. Each row presents data for one candidate region, showing the percentage of samples in which editing is observed in both strands (pink) or only one strand (blue). Other samples have exhibited no detectable editing in the region. The red and blue arrows point to specific regions whose data are presented in panels B. (B) Focused views of specific regions, showing the editing index over this specific region on both strands (A to G for the positive strand and T to C for the negative strand) across individual samples. Overall, in all regions analyzed, many samples exhibit editing on one strand only. If NAT pairing were the primary mechanism driving editing, we would expect to see editing occur simultaneously on both strands. (C) Distribution of Pearson's correlation coefficients between A-to-G editing indices (positive strand) and T-to-C editing indices (negative strand). Gray bars represent all candidate regions (n = 2503), and green bars highlight the subset with statistically significant correlation (FDR < 0.05, n = 906). The vertical dashed line marks r = 0. (D) Scatter plots showing the correlation between positive-strand (A-to-G) and negative-strand (T-to-C) editing indices for the two specific regions highlighted in panel B. Each point represents one sample. Pearson correlation coefficients (r) and P-values are shown.