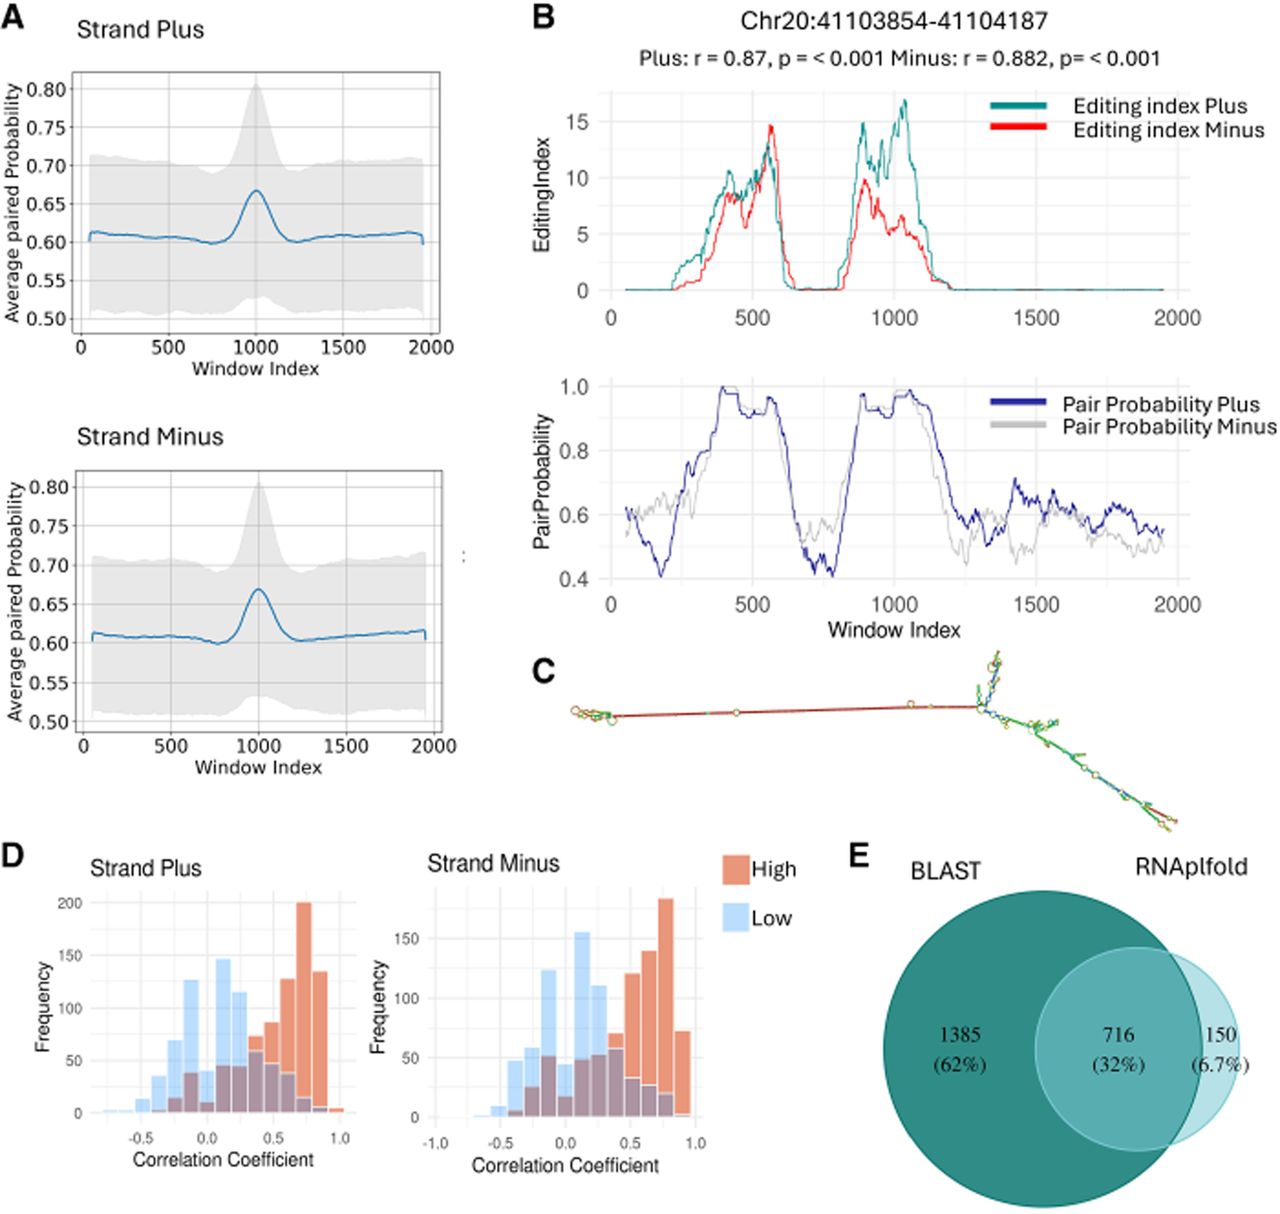
Most cis-NAT-candidate regions are characterized by putative intramolecular RNA structures. (A) The averaged base pair probability in a window surrounding 3184 NAT-candidate regions. The average was calculated using a 100 bp sliding window across a 2000 bp sequence surrounding the identified region, centered at the center of the NAT-candidate region. Results are presented for the plus (top) and minus (bottom) strands, separately. The gray area indicates the standard deviation. (B) Base pair probability and editing levels for both strands for a specific candidate region. (C) A secondary RNA structure predicted for the region shown in B. (D) Distribution of correlation coefficients between editing indices and pairing probabilities, calculated for regions exhibiting high pairing probability values (>0.8, n = 866; red) compared with the regions with the lowest base-pairing probability (n = 866; blue). Results are presented for the plus (left) and minus (right) strands, separately. The analysis was performed using samples from the brain cerebellum tissue, and a similar analysis for five tissues is shown in Supplemental Figure S3. (E) Venn diagram showing the number of regions with putative dsRNA structure based on either BLAST or RNAplfold and their overlap.