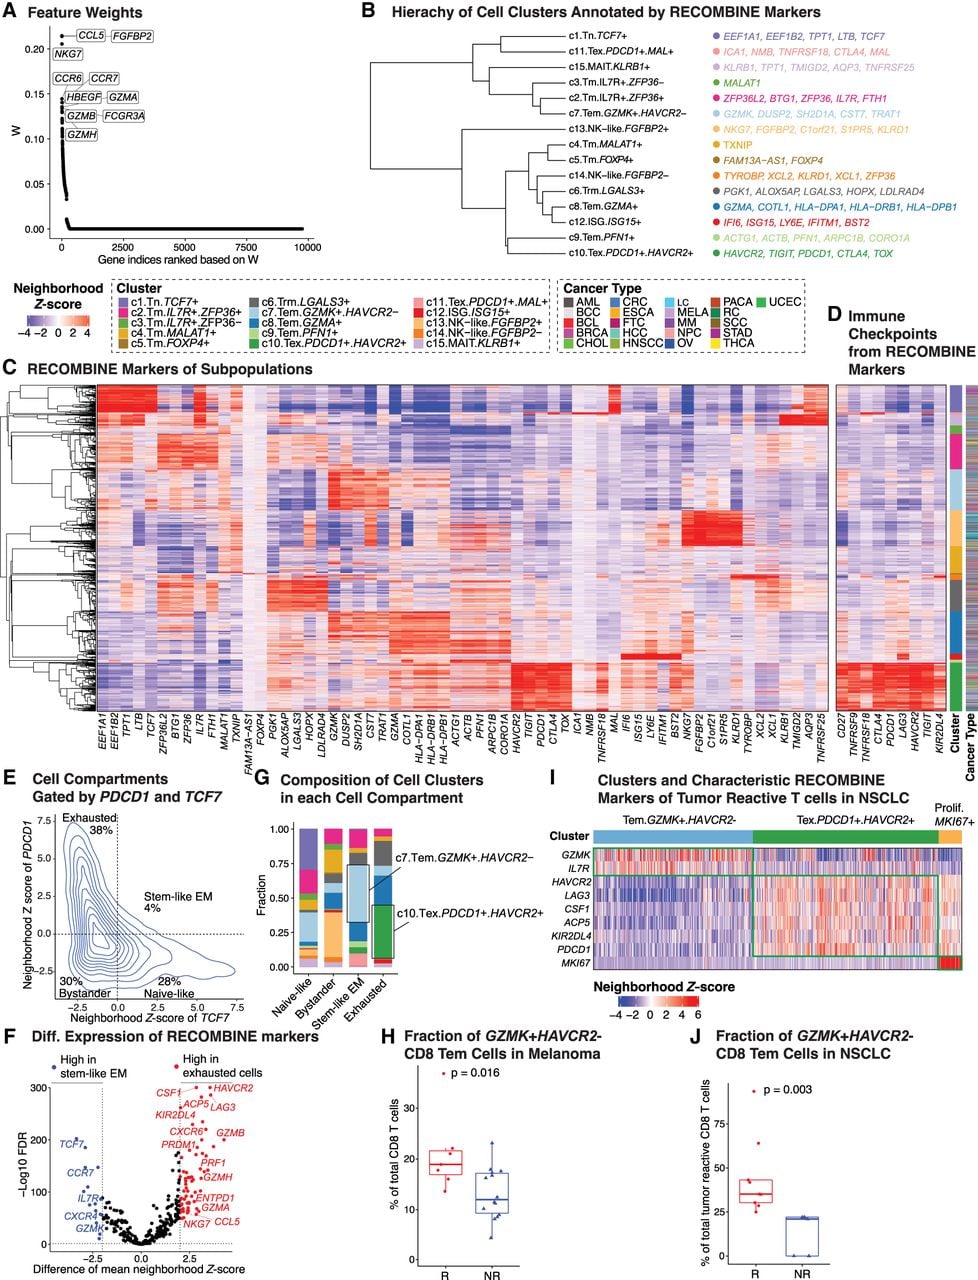
RECOMBINE identifies CD8+ T cell states and markers associated with cancer immunotherapy response. (A) Feature weights of all genes in which the top 10 discriminant markers are labeled. (B) Hierarchy of cell clusters annotated by top five RECOMBINE markers. (C) Heatmap of neighborhood Z-scores showing gene modules across clusters. (D) Heatmap of neighborhood Z-scores showing stimulatory and inhibitory immune checkpoint genes identified by RECOMBINE. (E) CD8+ T cell compartments gated by neighborhood Z-scores of TCF7 and PDCD1. (EM) Effector memory. (F) Differentially expressed markers between stem-like EM and exhausted T cell compartments defined in E. (G) Compositions of cell clusters across the cell compartments defined in E. (H) Comparison of GZMK+HAVCR2− Tem (c7 in RECOMBINE analysis) CD8+ T cell fractions in immunotherapy responders (R; N = 7) versus nonresponders (NR; N = 14) of melanoma patients treated with anti-PD-1 therapy (Sade-Feldman et al. 2018). (I) Heatmap of neighborhood Z-scores showing characteristic markers of clusters of 13,403 tumor-reactive CD8+ T cells from anti-PD-1-treated and treatment-naive patients with non-small-cell lung cancer (Liu et al. 2022). (J) Comparison of GZMK+HAVCR2− Tem cell fractions within tumor-reactive CD8+ T cells in anti-PD-1 therapy responder (R; N = 9) versus nonresponder (NR; N = 5) patients with non-small-cell lung cancer.